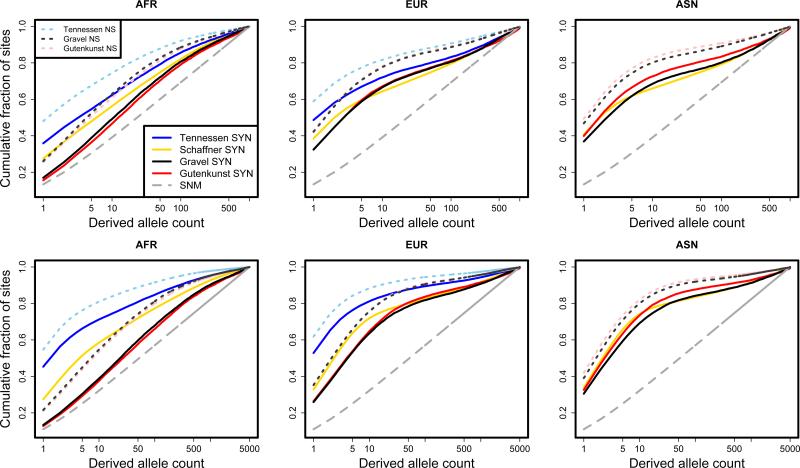
Figure 2.
Simulated cumulative site frequency spectra in three human continental groups under several recently inferred demographic models. Sample size is 103 chromosomes in the top panels and 5 × 10³ chromosomes in the lower panels. Note that the model of Tennessen et al. [2012] did not infer demography of the Asian continental group, so we do not plot a curve for this population. However, the Asian continental group is included in the Tennessen et al. [2012] simulations. Each curve was calculated using 103 independent simulations of 5 × 10³ base pairs each. The gray dashed curve represents the analytical expectation based on the standard neutral model and is not the result of simulations. (SNM: standard neutral model, AFR: African population, EUR: European population, ASN: Asian population, NS: non-synonymous, SYN: synonymous).

