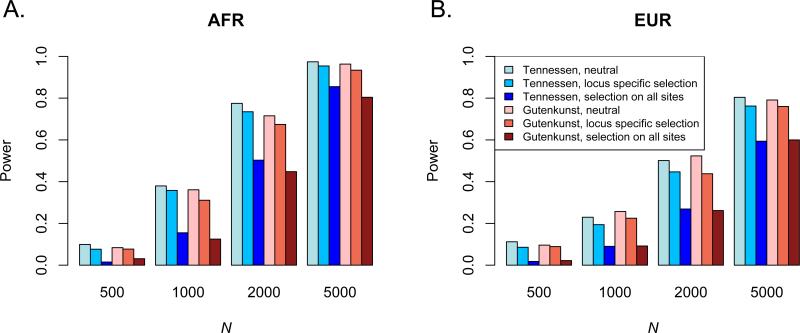
Figure 4.
Power of SKAT-O at the α = 10–6 level for two different models of demography with and without selection, for different sample sizes N. We applied both a locus specific model of selection (and a model that treats the entire 30kb locus as a single gene. All results are for a region on chromosome 3, hgl9 coordinates 50320000-50350000.

