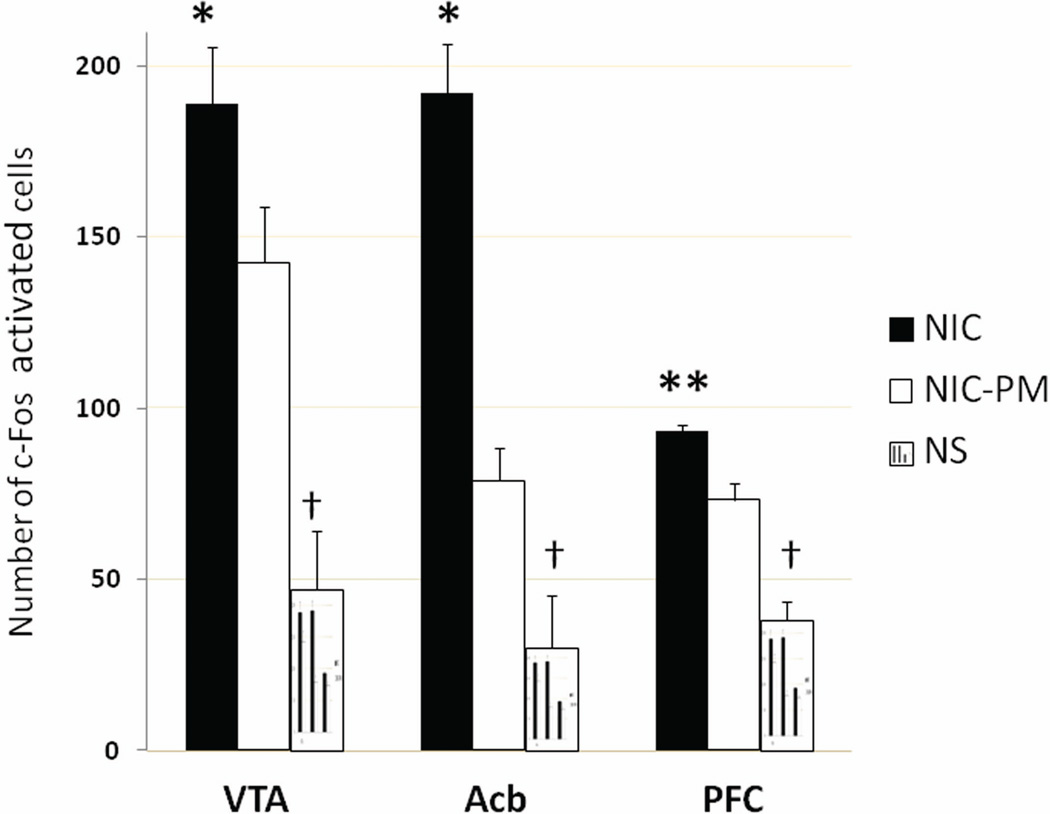
Figure 5.
Nicotine-induced activation of c-Fos at three representative sites in the mouse brain. Bars represent the mean (± standard error) number of c-Fos activated cells counted in ventral tegmental area (VTA), nucleus accumbens (Acb) and prefrontal cortex (PFC). c-Fos immunoreactivity was assessed following intraperitoneal administration of normal physiological saline (NS, control), nicotine hydrogen tartrate salt (NIC) or its peripherally-acting analog nicotine pyrrolidine methiodide (NIC-PM). Differences between the NS control and NIC or NIC-PM treatments were significant at †P<0.001 and between NIC and NIC-PM were significant at *P≤0.05, **P<0.001.

