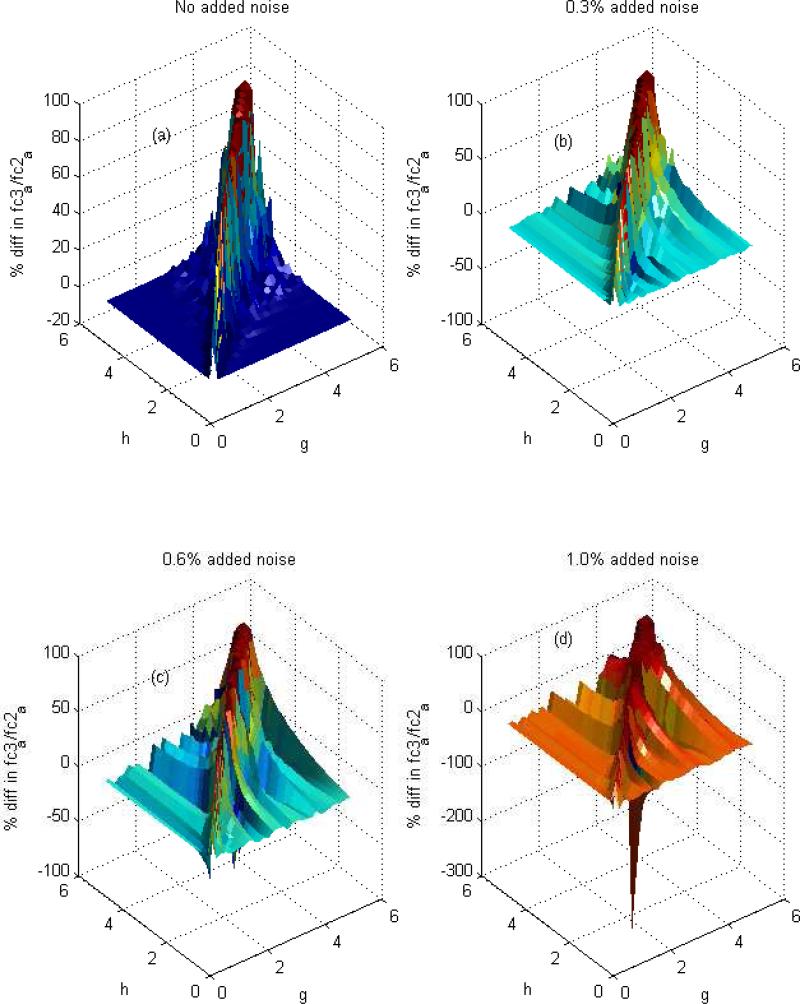
Figure 5. Fitting Simulated Data.
Illustrated are the results from analysis of simulated data under different conditions using the program “metabolic.m” in the supplementary material. The procedure is capable of computing a-h most accurately when exchange of glutamate and glutamine with α-ketoglutarate of astrocytes and neurons is quite different. This is demonstrated by finding the difference between the actual ratio of fc2a (acetyl-CoA labeled in positions 2) and fc3a (acetyl-CoA labeled in position 1 and 2) for a test model and the estimated fc3a/fc2a, using the synthetic data associated with this test model, as the input for the proposed procedure. Figure 5A shows that the error is small if g and h are considerably different from each other, but the procedure becomes less accurate in estimating a-h if g and h are nearly equal (error is highest on the diagonal). The noise plays a significant role in the precision of the computation (Figures 5B, 5C and 5D). With increasing the noise from 0 to 1 %, the procedure is less accurate in estimating a-h as represented by significantly worsening error.

