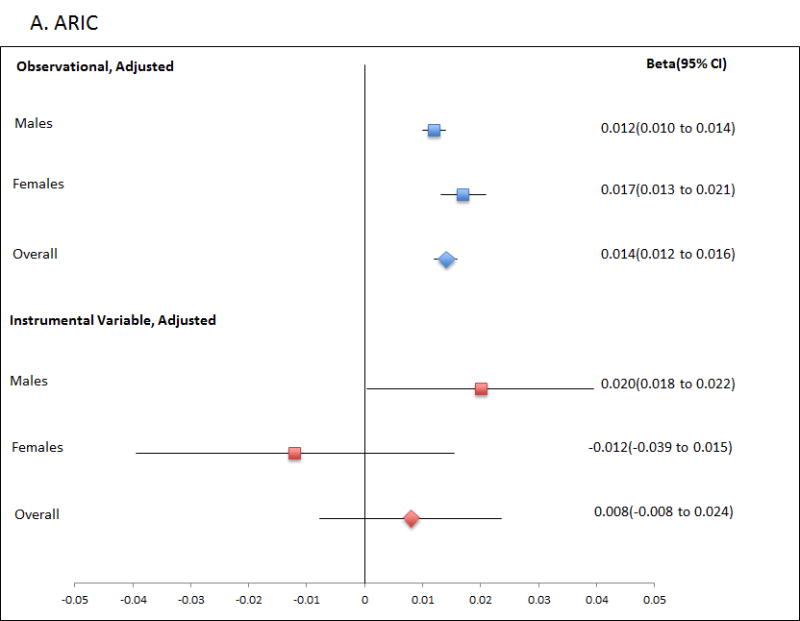
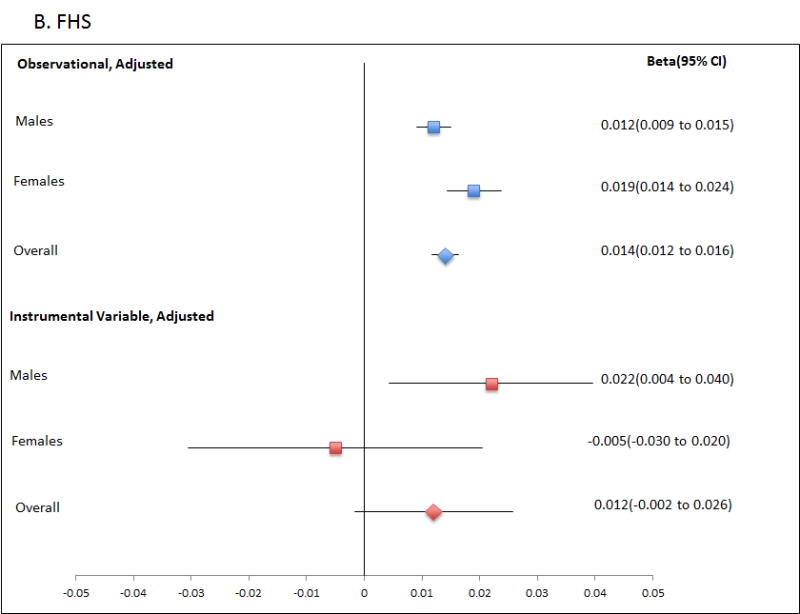
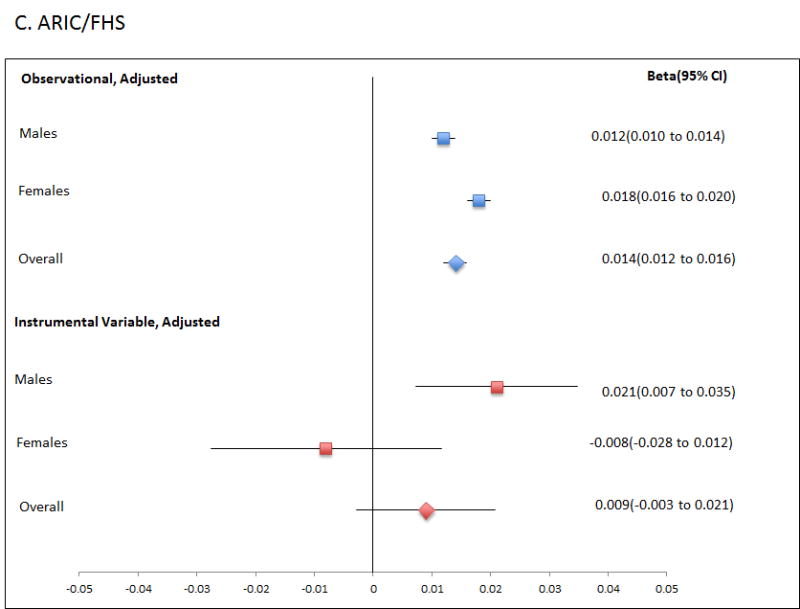
Figure 2.


Forest plot showing observational and instrumental variable estimates of the effect of Tg (mmol/L) on SU (mmol/L) in ARIC (A), FHS (B) and combined ARIC/FHS (C). The instrumental variable estimate represents the increase in SU per mmol/L increase in Tg attributable to the genetic risk score.
