Figure 1.
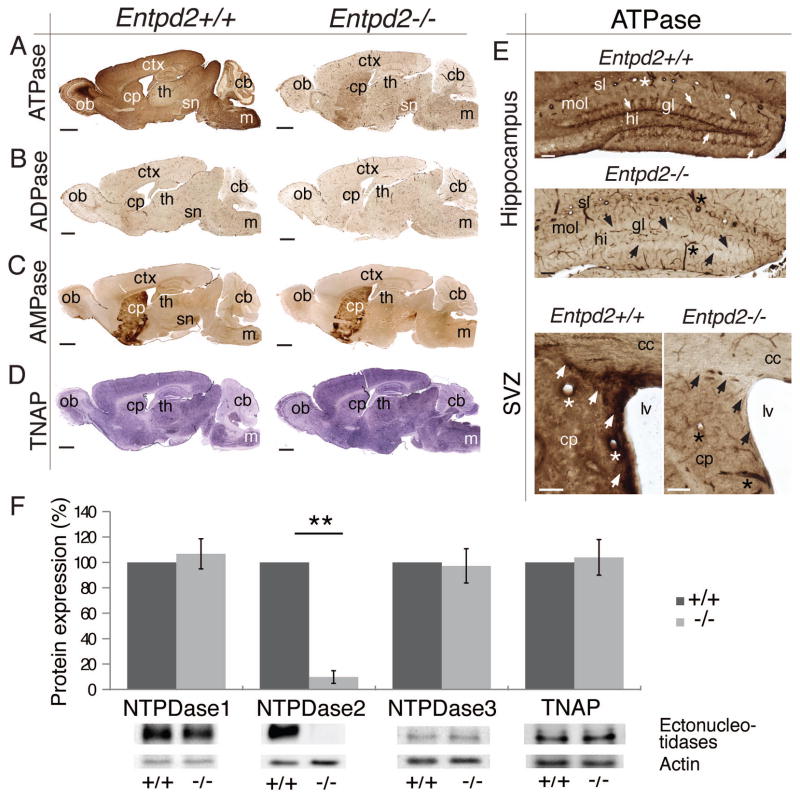
Distribution of ectonucleotidase activity in WT and Entpd2 KO mice. (A–D): Enzyme histochemical reaction product in parasagittal sections using ATP, ADP and AMP as a substrate for visualizing ectonucleotidase activity and BCIP/NBT for alkaline phosphatase (TNAP) activity. (E): Coronal sections of dentate gyrus (top) and the lateral ventricles (bottom). Arrows (top) depict the position of the radial type-1 cells and their ramifications that are intensely stained for ATPase activity in WT sections of the dentate gyrus and are not detectable in KO sections. Arrows (bottom) depict enhanced ATPase activity at the SVZ and its dorsal extension that is lost in Entpd2 KO mice. Asterisks indicate NTPDase1-expressing blood vessels. (F): Lack of upregulation of other ectonucleotidases in Entpd2 KO mice as revealed by immunoblotting. Bar graph (mean ± SEM) represents quantitative analysis of immunoblots for NTPDase1 to NTPDase3 and TNAP in WT (+/+) and KO (−/−) mice. Actin served as a loading control. The apparent molecular masses (kDa) of the ectonucleotidases correspond to 72 (NTPDase1), 70 (NTPDase2), 75 (NTPDase3), and 75 (TNAP). n=10 mice for each condition. ** p<0.01, significant relative to control. cb, cerebellum; cc, corpus callosum; cp, caudoputamen; ctx, cerebral cortex; gl, granule cell layer; hi, hilus; m, medulla oblongata; lv, lateral ventricle; mol, molecular layer; ob, olfactory bulb; sl, stratum lacunosum; sn substantia nigra; th, thalamus. (Scale bars, 500 μm, A–D; 100 μm, E)

