
Figure 5.
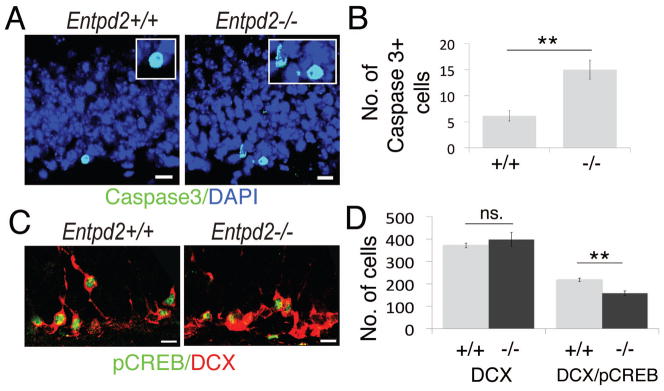
Analysis of apoptosis and immunofluorescence for pCREB. (A): Immunofluorescence for activated caspase-3 (green); DAPI, blue. Boxed regions: enlarged images of caspase-3-labeled cells (B): Corresponding quantification of caspase-3-positive cells in the SGL of WT (+/+) (n=7) and KO (−/−) (n=6) animals. (C): Immunofluorescence for pCREB (green) and DCX (red) in the SGL. (D): Corresponding quantification of DCX-positive cells (left bars) and pCREB-labeled DCX-positive cells (right bars) in WT (+/+) (n=7) and KO (−/−) (n=5) animals. Bar graphs are mean ± SEM. **p<0.01, significant relative to control, n.s., difference not significant. (Scale bars, 10 μm, A,C)