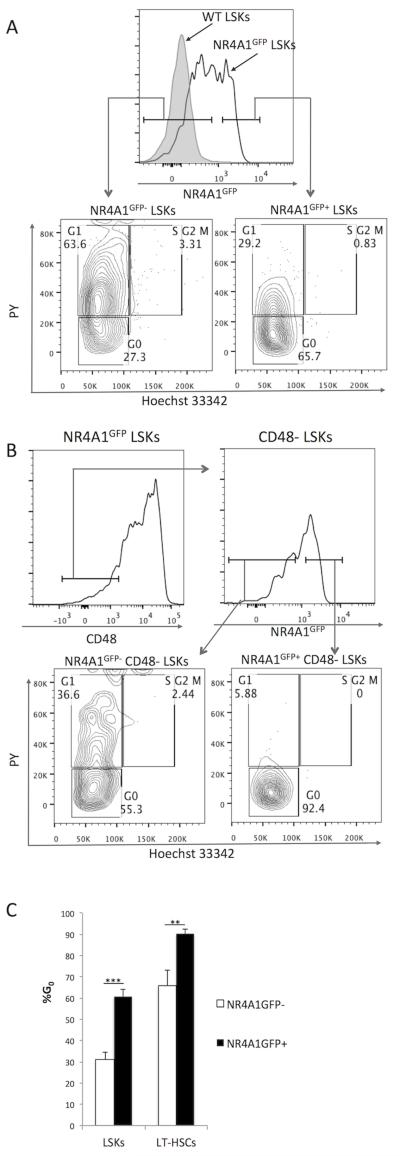
Fig. 2. NR4A1 expression identifies quiescent LSKs.
Lineage− bone marrow (Lin− BM) cells from NR4A1GFP mice were isolated and stained with Hoechst33342 and Pyronin Y (PY) for cell cycle analysis. (A) Comparison of cell cycle status of NR4A1GFP+ vs. NR4A1GFP− LSKs. (B) Comparison of cell cycle status of CD48− NR4A1GFP+ vs. CD48− NR4A1GFP− LSKs. Results are representative of three independent experiments, each of which analyzed 2-3 NR4A1GFP mice and one non-transgenic littermate control and/or one B6 WT control (Note: The Hoechst and PY staining protocol requires a 60-minute 37°C incubation, which increases baseline NR4A1GFP expression (Fig. S3)). (C) Percentage of NR4A1GFP+ vs. NR4A1GFP− LSKs and CD48-LT-HSCs found in G0 based on Hoechst and PY staining. Results are measurements from four different NR4A1GFP transgenic reporter mice. **p=.0007, ***p<.0001 (unpaired student’s t-test).

