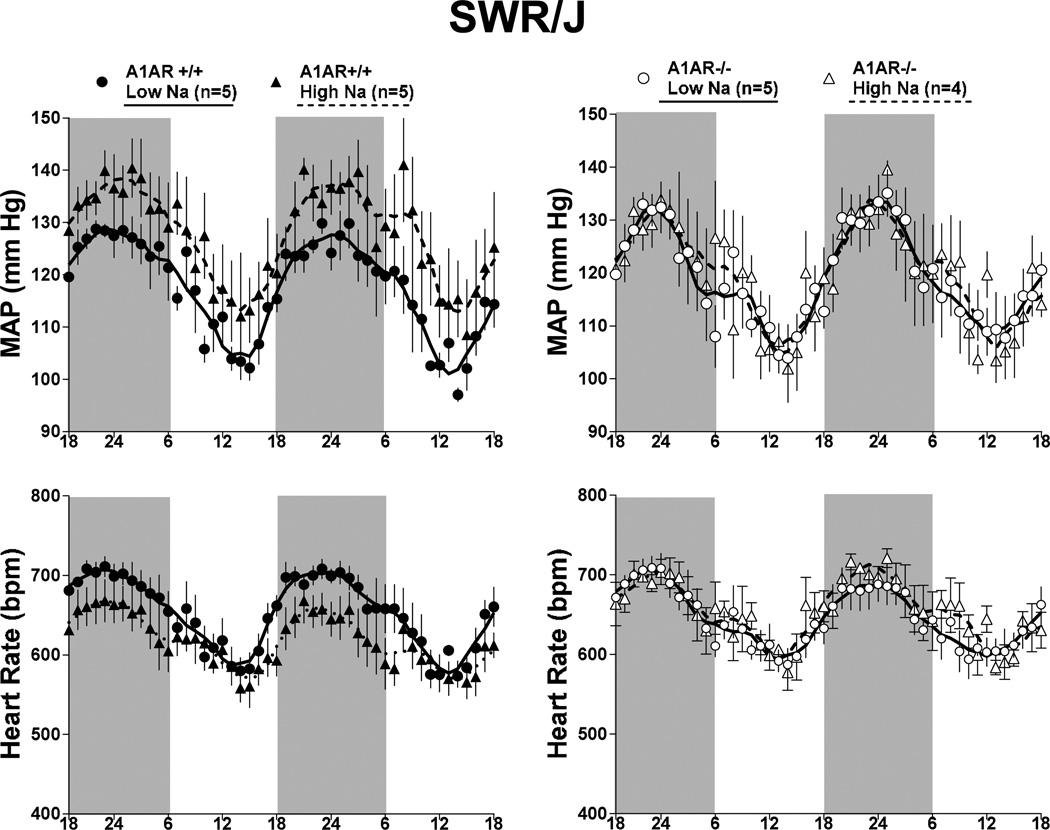
Figure 6.
Telemetric recordings of mean arterial pressure (MAP, top) and heart rates (bottom) in A1AR+/+ (left, closed symbols) and A1AR−/− mice (right, open symbols) on SWR/J genetic background. Mice received either a low (circles) or high Na diet (triangles). Data are shown for two consecutive days on 12:12-h light/dark cycles (dark periods from 18 h to 6 h indicated by shaded areas). Lines represent smoothed data using the weighted average of the nearest 9 points.

