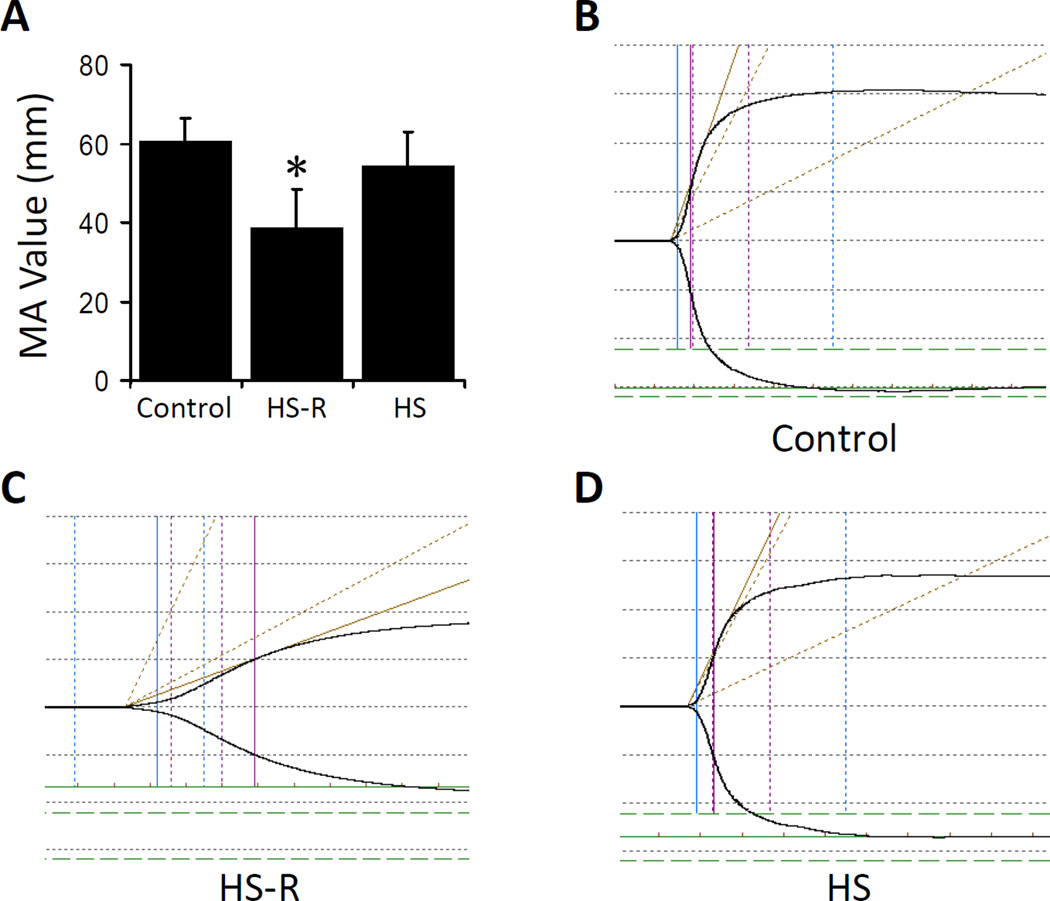
Figure 1.
Changes of platelet function in hemorrhagic shock mouse models. Thromboelastography (TEG) was used to investigate platelet function via maximal amplitude (MA) after HS or HS-R. A: MA value significantly decreased in HS-R mice compared with control and HS alone. Data shown are means ± SEM, n = 8–10 mice/group. *p<0.05 vs. control; B: Representative tracing of control mice; C: Representative tracing of HS-R mice; D: Representative tracing of HS group. x axis, time (min); y axis, maximum amplitude (mm).

