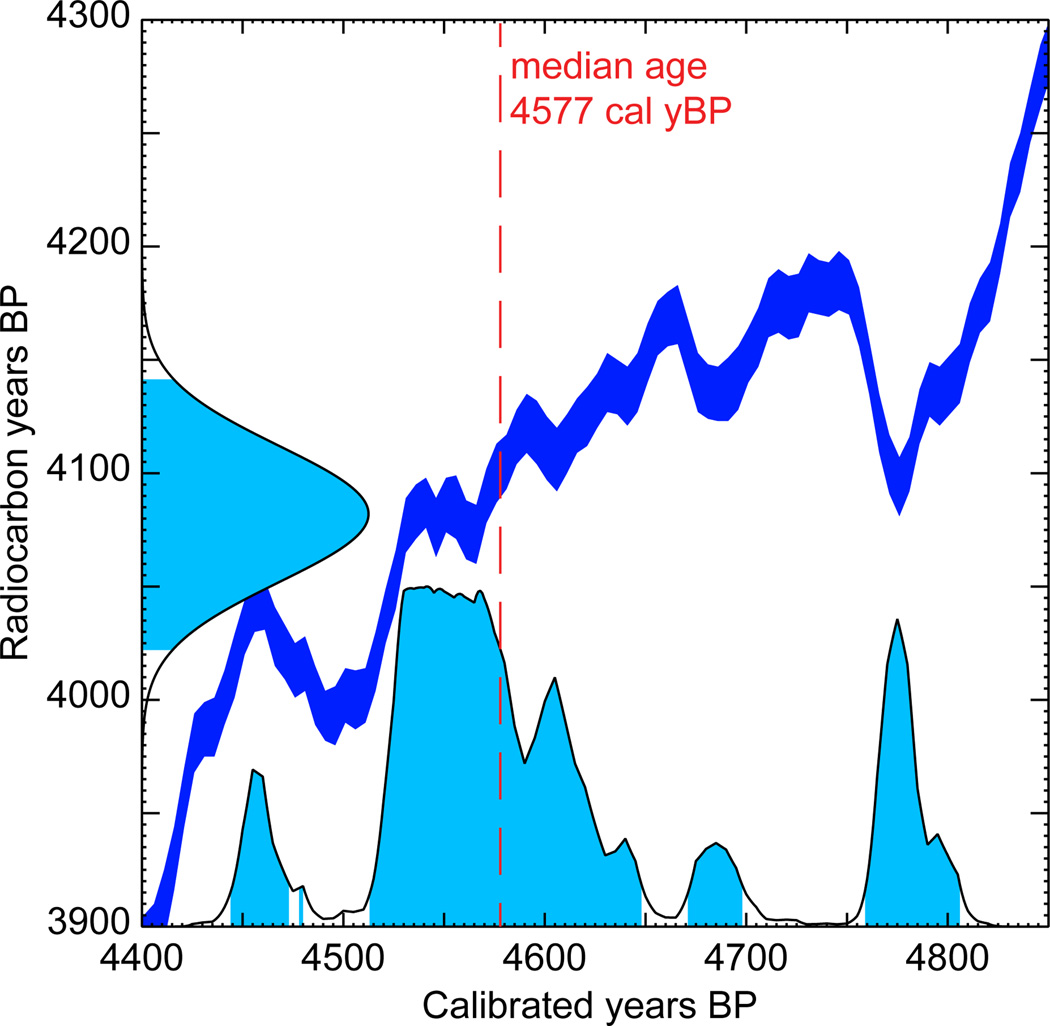
Figure 1.
Example of a calibration plot with a multimodal probability distribution. The radiocarbon age estimate of the sample is 4082±30 14C yBP. The median calibrated age estimate of the sample is 4577 cal yBP. The probability density functions of the uncalibrated and calibrated ages are plotted along the y- and x-axes, respectively. Conversion between the two is performed using IntCal13 calibration curve (in dark blue).

