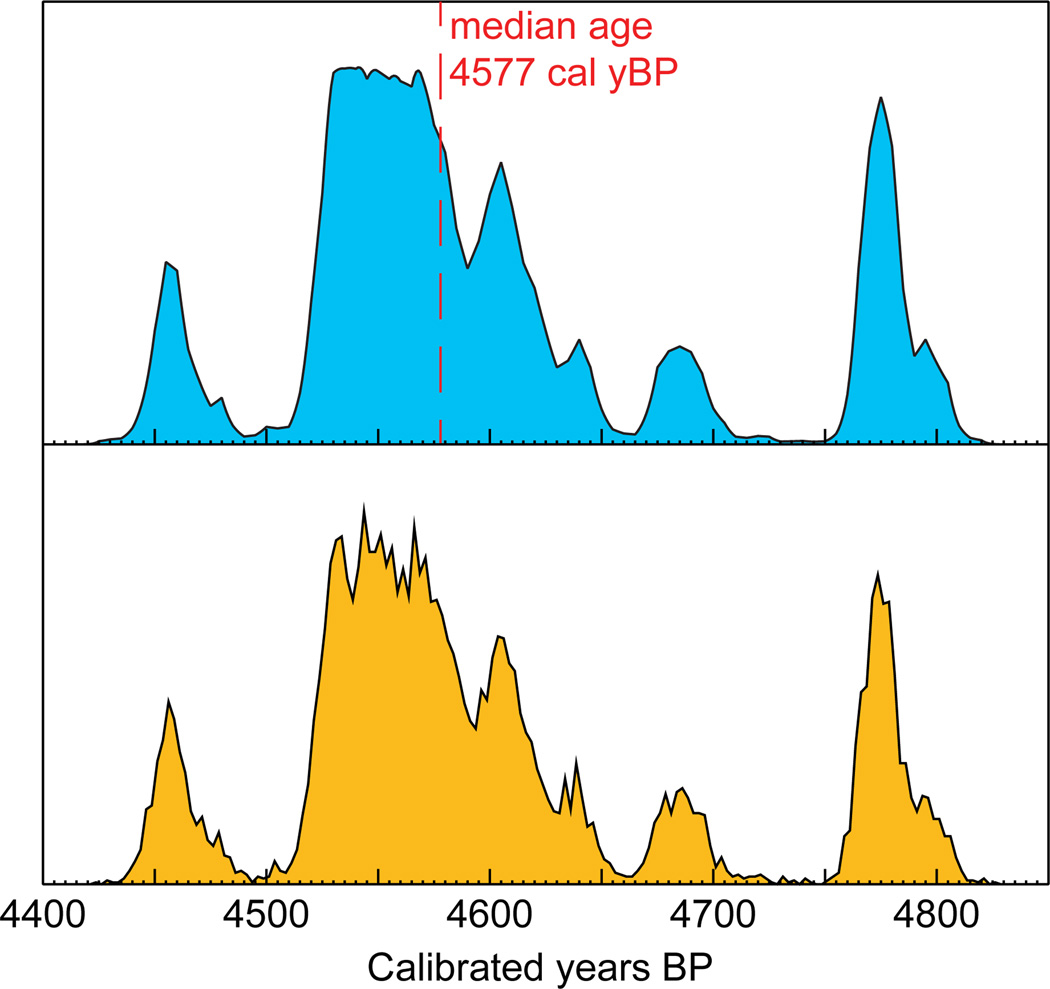
Figure 2.
Example of a posterior distribution of a sample age (bottom plot, orange) compared with the calibration plot obtained in CALIB (top plot, blue) and used as a prior for Bayesian phylogenetic analysis. The vertical axis represents the probability density. Note that the figure shows ages in yBP (before 1950), whereas ECRS yields posterior ages in years before 2010.

