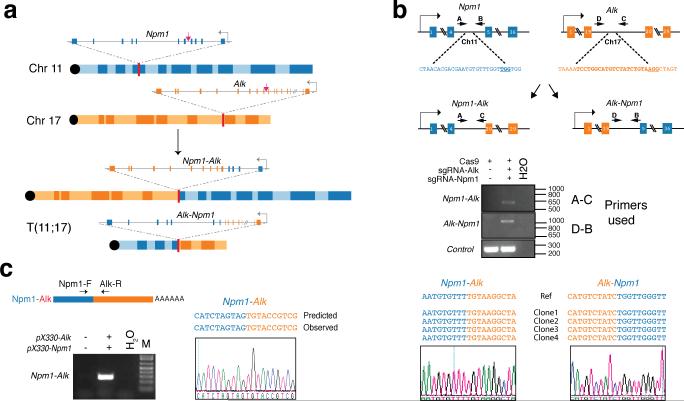
Extended Data Figure 2. Induction of the Npm1-Alk translocation in NIH/3T3 cells.
(a) Schematic of the Npm1-Alk translocation. Red arrows indicate the sites recognized by the sgRNAs. (b) Sequences recognized by the sgRNAs and location of primers used to detect the Npm1-Alk and Alk-Npm1 rearrangement (top panel). PCR on genomic DNA extracted from NIH/3T3 co-transfected with pX330 constructs expressing the indicated sgRNAs (middle panel). Sequences of four independent subclones obtained from the PCR products and representative chromatogram (bottom panel). (c) Detection of the Npm1-Alk fusion transcript by RT-PCR on total RNAs extracted from NIH/3T3 cells cotransfected with the indicated pX330 constructs (left panel). The PCR band was extracted and sequenced to confirm the presence of the correct Npm1-Alk junction (bottom-right panel). Representative results from two independent experiments.

