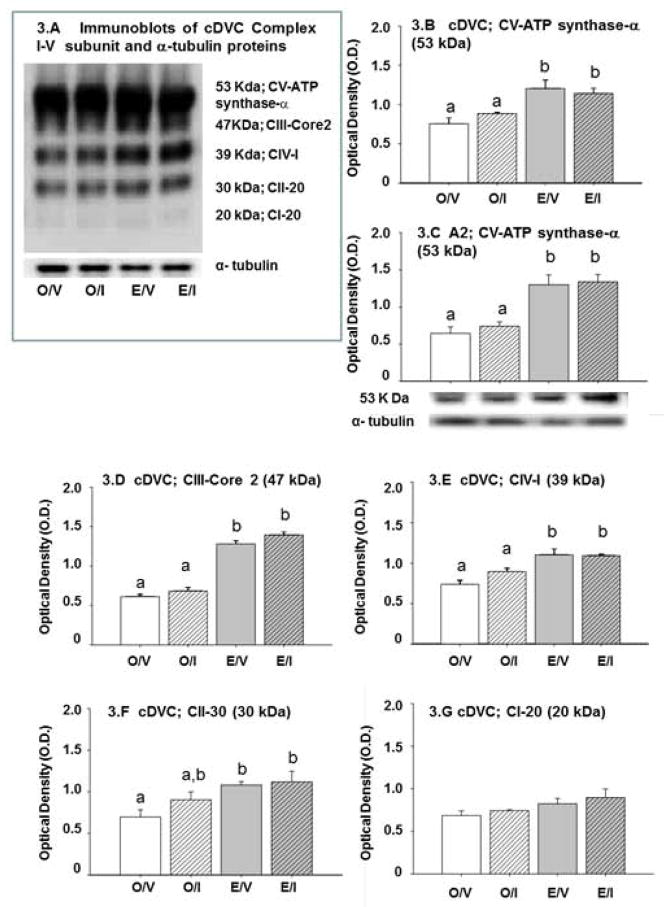
Figure 3. Effects of IIH on cDVC and A2 Nerve Cell Respiratory Chain Complex I–V Protein Subunit Expression in E and O Rats.
The immunoblot at upper left (Figure 3.A) shows that Complex V (CV) ATP synthase-subunit alpha (53 kDa), Complex III (CIII) subunit Core 2 (CIII-core 2; 47 kDa), Complex IV (CIV) subunit I (CIV-I; 39 kDa), Complex II (CII) subunit 30 kDa (CII-30; 30 kDa), and Complex I (CI) subunit NDUFB8, CI-20 (20 kDa) were each detected in cDVC tissue from O/V, O/I, E/V, and E/I rats. Blots were performed in triplicate. Mean O.D. values ± S.E.M. for cDVC Complex I–V protein subunit expression in O/V, O/I, E/V, and E/I rats are presented in Figures 3.B (ATP synthase-subunit alpha), 3.D (cDVC CIII-core), 3.E (cDVC CIV-I), 3.F (cDVC CII-30), and 3.G. (cDVC CI-20) (9.G). Only ATP synthase-subunit alpha was measurable in A2 cell samples (n=50 A2 cells/treatment group; n=12–13 neurons per rat); Figure 3.C depicts normalized protein O.D. values ± S.E.M. and representative immunoblot. Data labeled with dissimilar letters show statistical difference. cDVC and A2 respiratory chain complex subunit profiles were up-regulated by estrogen, but unchanged in response to IIH in E and O rats.

