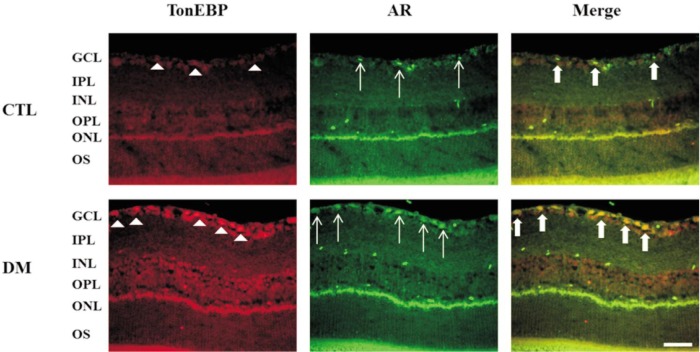
Figure 3. Colocalization of TonEBP and AR expression in the retinas of diabetic mice. Note that there was a dramatic increase in TonEBP and AR expression in GCL of diabetic retina and their colocalization was shown in the merged image.
GCL: Ganglion cell layer; IPL: Inner plexiform layer; INL: Inner nuclear layer; OPL: Outer plexiform layer; ONL: Outer nuclear layer; OS: Outer segment; AR: Aldose reductase. Scale bar, 50 µm. White arrow head: Increased in TonEBP, White arrow: Increased in AR, Bold arrow: GCL of diabetic retina and their colocalization.

