Figure 1.

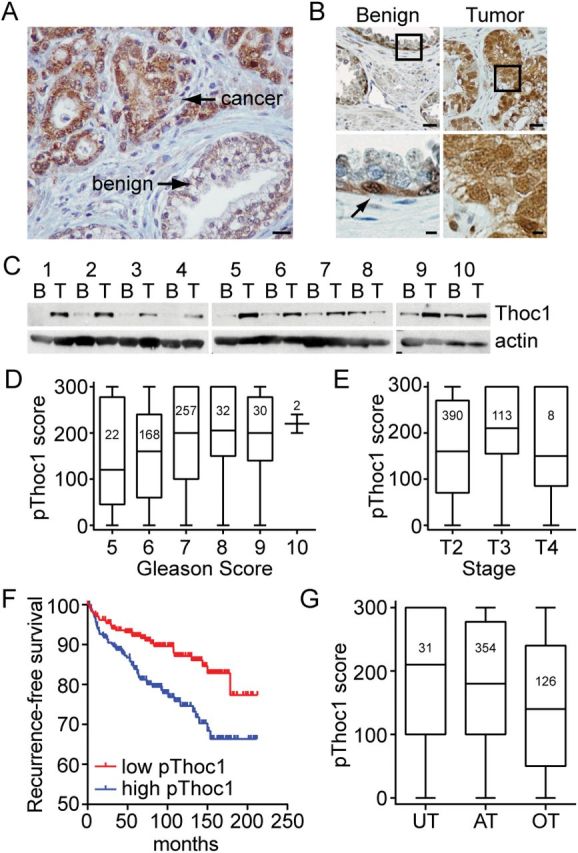
Thoc1 protein expression in human prostate cancer. A) Tissue sections from resected human prostate cancer specimens were immunostained for pThoc1. A representative image showing malignant and adjacent benign epithelium is shown. The scale bar represents 50 microns. B) A human tissue array containing 707 matched tumor and benign prostate tissue cores was immunostained for pThoc1. A representative pair of matched specimens is shown. The boxes represent the area magnified in the lower panels. The arrow represents an immunopositive cell. Scale bars are 50 (upper panel) or 10 microns (lower panel). C) Matched human tumor (T) or benign (B) prostate tissue specimens were analyzed for pThoc1 levels by western blotting. Actin is the protein loading control. D) Patient samples were stratified by Gleason score and pThoc1 immunostaining scores compared. The graph shows a box plot of the data with whiskers defining the range of scores. The numbers inside the boxes indicate sample size. E) Patient samples were stratified by TNM stage and pThoc1 immunostaining scores compared as in (D). F) 511 evaluable prostate cancer patient cores were stratified by pThoc1 immunostaining (above and below median) and biochemical recurrence (time to PSA > 0.4ng/mL) was assessed. Number of patients at risk were: 0 months low = 245, high = 245; 50 months low = 204, high = 182; 100 months low = 117, high = 84; 150 months low = 50, high = 37; 200 months low = 6, high = 7. G) Evaluable patient specimens were stratified as overtreated, appropriately treated, or undertreated and pThoc1 immunostaining analyzed as in (D). AT = appropriately treated; OT = overtreated; UT = undertreated.
