
Figure 2.
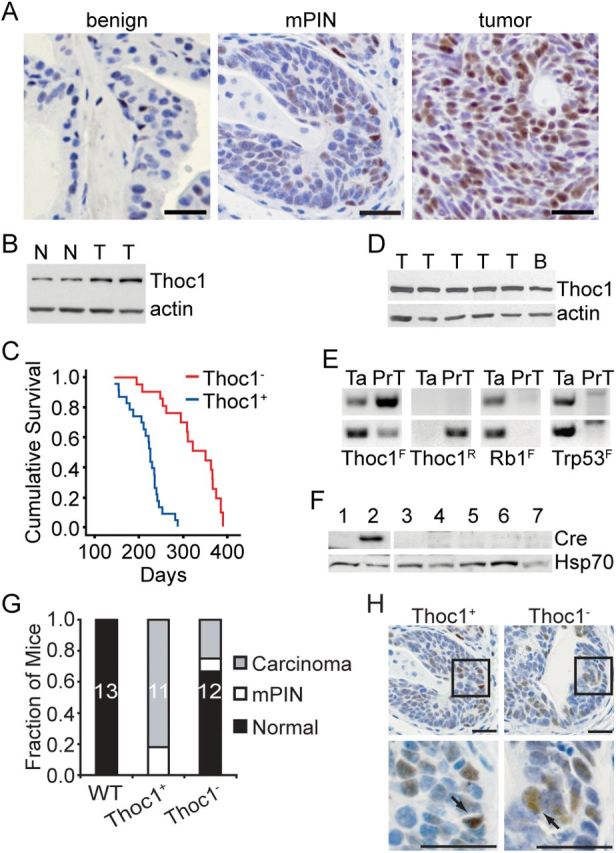
Thoc1 deletion in a mouse model of prostate cancer. A) Tissue sections containing benign epithelium, mPIN lesions, or prostate tumors were immunostained for pThoc1. Scale bars represent 50 microns. B) Thoc1 protein levels were analyzed by western blotting in normal (N) or tumor-bearing prostate tissue (T) in the Rb1/Trp53 mouse model of prostate cancer. Actin is the protein loading control. C) The cumulative survival of mice of the indicated genotypes is shown. The Thoc1 - cohort includes 23 mice while the Thoc1+ cohort includes 22 mice. D) Western blot analysis of pThoc1 in representative prostate tumors (T) from Thoc1 - mice. Normal brain tissue (B) serves as a positive control. Actin is the protein loading control. E) Polymerase chain reaction genotyping of the unrecombined (F) or recombined (R) floxed alleles for the indicated genes is shown. The DNA was extracted from the tail (Ta) or from prostate tumor cells (PrT). The upper and lower panels are samples from two different Thoc1 - mice. The prostate tumor cells retain at least one unrecombined floxed Thoc1 allele. F) Western blot analysis of Cre recombinase levels in normal ventral prostate tissue from one wild-type mouse lacking the PB-Cre4 transgene (lane 1, negative control), uninvolved ventral prostate tissue from one Thoc1 - mouse (lane 2, positive control), prostate tumors from two Thoc1 + mice (lanes 3, 7) or three Thoc1 - mice (lanes 4, 5, 6). Hsp70 is the protein loading control. G) A cohort of 20-week-old mice with the indicated genotypes was sacrificed and prostate histopathology examined by serially sectioning through the entire gland. Each mouse was scored based on the most advanced neoplastic lesion detected. The fraction of mice scored in each category is indicated. The sample size is shown within the bar. H) Prostate tissue sections from mice of the indicated genotypes containing mPIN lesions were immunostained for pThoc1. The boxes highlight the region magnified in the lower panels. Arrows indicate pThoc1 positive cells. The scale bars represent 50 microns.