
Figure 4.
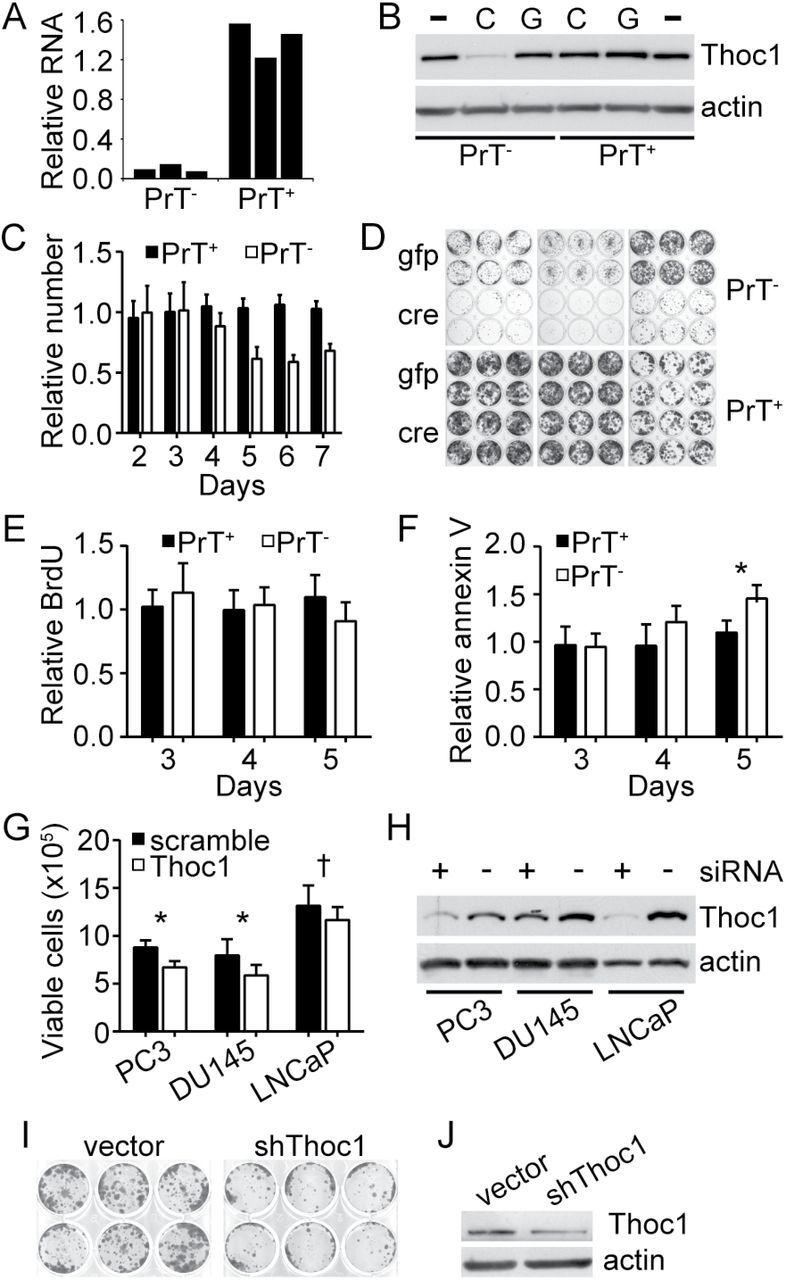
Effects of Thoc1 deficiency on prostate tumor cell viability in vitro. A) PrT+ or PrT- were treated with AdCre or AdGFP and Thoc1 RNA levels measured by quantitative reverse transcription–polymerase chain reaction as in Figure 3. The graph shows RNA levels of AdCre-treated cells relative to AdGFP-treated control cells. Each bar represents data from one biological replicate for a different PrT cell line. B) Thoc1 protein levels were measured by western blotting. PrT+ or PrT- were untreated (-), treated with AdCre (C), or treated with AdGFP (G). Actin is the protein loading control. The results are representative of three independent PrT cell lines for each genotype. C) PrT+ or PrT- were treated with AdCre or AdGFP and cell numbers counted over time. The graph shows the number of AdCre-treated cells relative to the number of AdGFP-treated cells. Each column represents the mean and standard deviation for six independent experiments with two independent PrT cell lines. D) Equal numbers of viable PrT+ or PrT- treated with either AdGFP (gfp) or AdCre (cre) were plated at low density. Cells were fixed and colonies counted nine days later. Each twelve-well plate shows results of an independent PrT cell line. The results are representative of two or more independent experiments. E) PrT+ or PrT- were treated with AdCre or AdGFP and pulse labeled with BrdU at the indicated time subsequent to infection. The graph shows the percentage of BrdU-positive AdCre-treated cells relative to AdGFP-treated cells. Data for each bar is the mean and standard deviation from four to five independent experiments. F) PrT+ or PrT- were treated as in (E) and the percentage of annexin V–positive AdCre-treated cells relative to AdGFP-treated cells is shown. Each bar represents the mean and standard deviation for three to four independent experiments. The asterisk denotes a statistically significant difference (t test P = .02). G) The indicated cell lines were transfected with siRNA targeting THOC1 or a scrambled control. The number of viable cells was counted three days later. The graph shows the mean and standard error for three biological replicates, each performed in triplicate. The P value of the Student’s t test is indicated for each line (*<.005, †<.05). H) The indicated cell lines treated as in (G) with Thoc1 targeted siRNA (+) or scrambled control siRNA (-) were analyzed for pThoc1 by western blotting. Actin is the protein loading control. I) PC-3 cultures were infected with a pool of lentivirus expressing three shRNA targeting different regions of the THOC1 transcript (shThoc1), or with an empty vector control virus and were plated at low density to assess clonogenic growth as in (D). J) PC-3 cells treated as in (I) and pThoc1 levels measured by western blotting. Actin is the protein loading control. All statistical tests were two-sided.