
Figure 6.
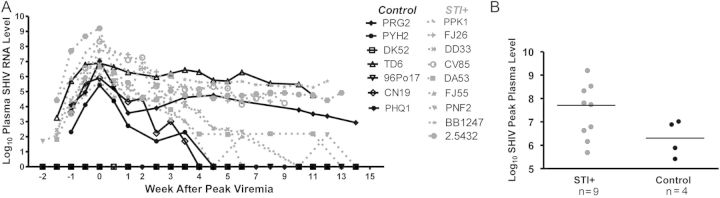
A, Longitudinal plasma simian/human immunodeficiency virus (SHIV) RNA levels. Log10 SHIV RNA levels plotted (y-axis) for sexually transmitted infection (STI)–positive (grey dashed) and control (black solid) animals, relative to the time of peak viremia (x-axis). Differences in levels in SHIV-infected animals between the 2 study groups were not statistically significant (96Po17, DK52, and PHQ1 were excluded from analyses as uninfected macaques). B, Peak plasma SHIV RNA levels. No significant difference was noted between SHIV-infected, STI-positive (grey) and control macaques. Hash indicates median levels.