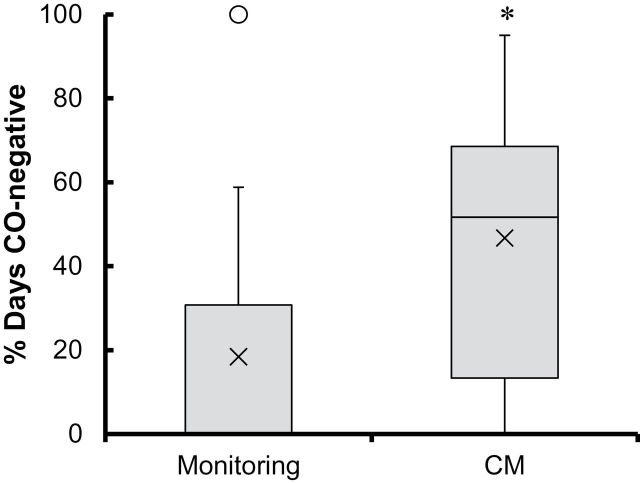
Figure 2.
Box and whisker plot of percent of days CO-negative (CO ≤ 6 ppm) in the monitoring (n = 21) and CM (n = 24) conditions. In the monitoring condition, the median was zero. The ends of the whiskers are the minimum (bottom) and maximum (top) values save the outlier, defined as any value more than 1.5 times the length of the box from either end of the box and indicated here by an open circle for visual purposes only. All data were included in analyses. × indicates the mean; * indicates significant differences between study conditions at p = .002 for the analysis omitting days of missed samples, and p = .008 for the analysis coding days with missed samples smoking-positive. CM = contingency management; CO = carbon monoxide.

