1.

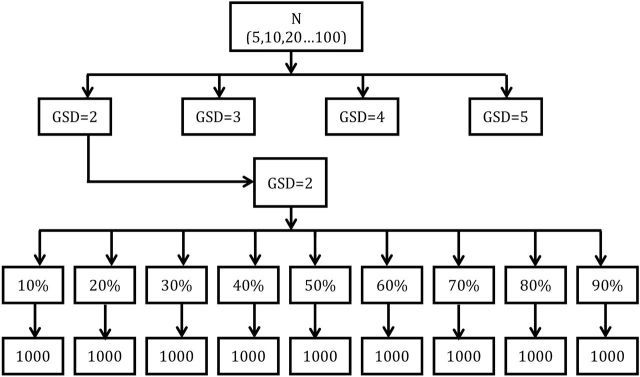
A graphical depiction of the simulation design. Sample sizes (N) were fixed at 5, 10, 20, 30, 40, 50, 60, 70, 90, and 100. For each sample size, data were drawn from a lognormal distribution with a true GM = 1 and true GSDs of 2, 3, 4, and 5, respectively. Datasets were censored in increments of 10% with either a single LOD value or multiple LODs. For each combination of N, GM, GSD, and percent censored, 1000 datasets were generated and analyzed using the β-substitution, the ML, and the K-M methods. A mixed lognormal distribution is created by combining two lognormal distributions with GM1=1 and GM2 = 5 or 10.
