4.
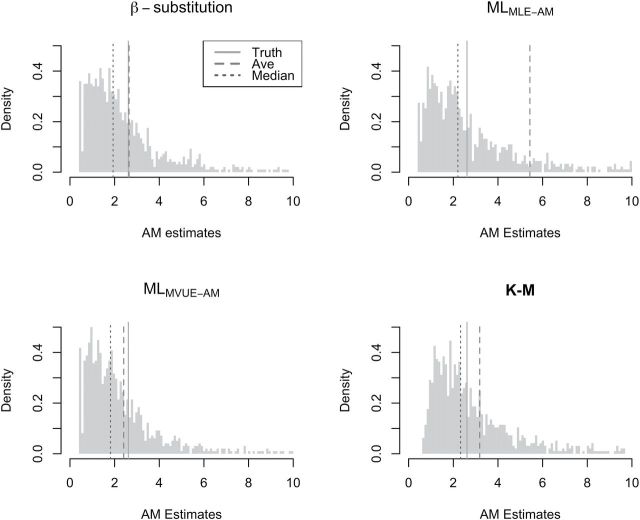
Histograms of the AM estimates from 1000 simulated datasets under the condition of N = 5, GM = 1, GSD = 4, and percent censoring = 40 for three estimation methods. MLMLE-AM and MLMVUE-AM denote two different ways of estimating the AM from the ML estimates of µ and σ from the log-transformed data. The average, the median, and the true AM vertical lines showed the sensitivity of the average in a skewed distribution. The MLMLE-AM had a large variability, resulting in a higher average AM value compared the other methods.

