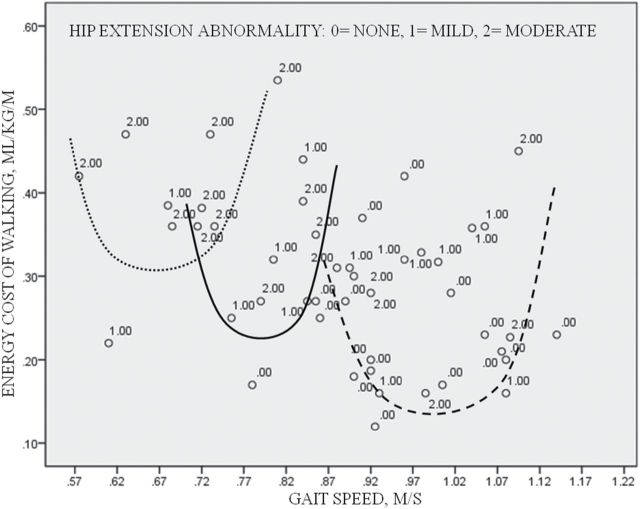
Figure 1.
Shifts in the J-curve of the energy cost–speed relation. Within an individual, the preferred gait speed relates to the lowest energy. More abnormal gait shifts the J-curve relation upward and to the left, but for the abnormal gait, the energy cost of walking remains lowest at a preferred gait speed. Within each “J-curve,” those with the greatest hip extension abnormality tend to have the highest energy cost and walk at gait speeds below or above preferred speed. Visual approximates of J-curves for energy cost-speed relations among older adults with abnormal gait who walked: very slow, dotted line; moderately slow, solid line; and slow, dashed line.

