
Figure 5.
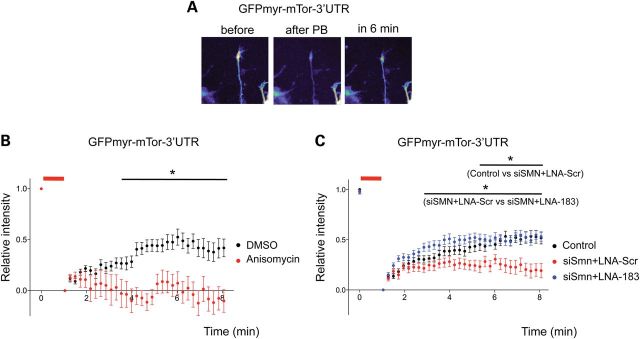
mTor is locally translated in the axon and growth cones. (A) Representative images demonstrate FRAP in distal axons of hippocampal neurons transfected with dGFPmyr-mTor 3′ UTR over a period of 6 min. (B) Quantification of GFP intensity of dGFPmyr-mTor-3′ UTR in the distal axons and growth cones before and after photobleaching (PB). Anisomycin (50 µm, red) blocked recovery of GFP signal after PB compared with vehicle-treated neurons (DMSO, black). For each time point, the data represent a relative ratio of prebleach intensity (mean ± SEM). DMSO: n = 33 regions from 11 neurons, anisomycin: n = 17 regions from 5 neurons. Statistical significance was determined by two-way ANOVA followed by Bonferroni's post hoc test. DMSO versus anisomycin: *P < 0.05 from 3.99 to 8.06 min (C) Smn-knockdown neurons showed significantly reduced recovery of GFP signal, and inhibition of miR-183 in Smn-deficient neurons restored it. Control (black): n = 52 from 19 neurons, Smn-knockdown (red): n = 52 from 17 neurons and Smn and miR-183 double knockdown (blue): n = 44 from 12 neurons. Control versus siSMN + LNA-Scr; *P < 0.05 from 5.35 to 8.06 min, siSMN + LNA-Scr versus siSMN + LNA-183; *P < 0.05 from 2.86 to 8.06 min. Red bars represent times of photobleaching.