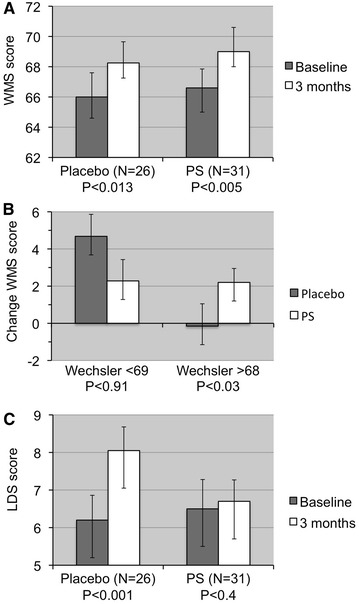
Fig. 3.

WMS score results. Mean ± SEM and P values for one-tailed t test are indicated. a Test score before and after 3 months of PS+PA supplementation. b Change in WMS score after 3 months of PS+PA supplementation by baseline level (T1). c Depressive symptoms score before and after 3 months of PS+PA supplementation. LDS List of Depressive Symptoms, PA phosphatidic acid, PS phosphatidylserine, WMS Wechsler Memory Scale
