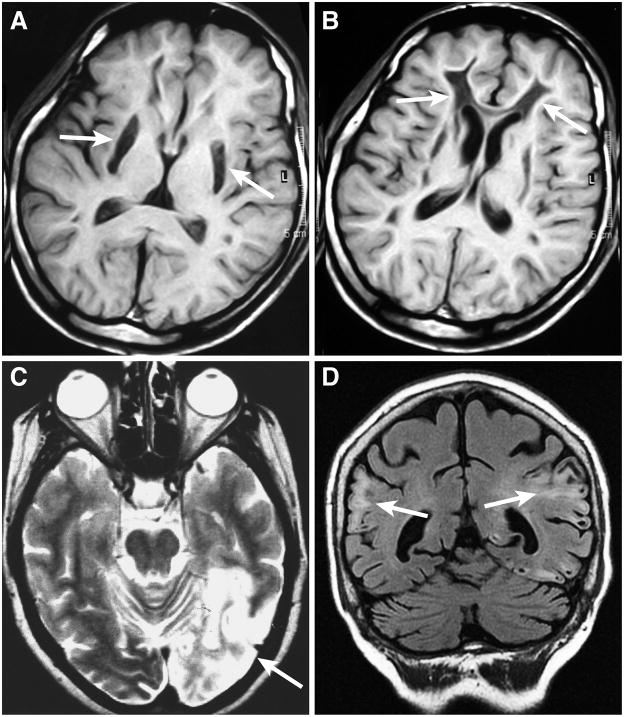
Figure 5. Brain magnetic resonance images (MRI) of mitochondrial encephalomyopathies.
Two axial brain T1-weighted images from the same patient with Leigh’s syndrome due to complex I deficiency are shown in (A) and (B). In (A), bilateral necrotizing striatal lesions (arrows) and widespread leukoencephalopathy are visible. In (B), the leukoencephalopathy presents with cavitations in the frontal white matter (arrows). Brain images from two MELAS patients are shown in (C) and (D). Axial T2-weighted image (C) shows a large hyperintense area extending in the occipital and parietal lobes of the left hemisphere (right side of image, arrow), the classical posterior location for stroke-like lesions in a patient with the most frequent MELAS m.3243A>G/tRNALeu(UUR) mutation. In another MELAS patient (D), with a complex I mtDNA mutation, multiple and bilaterally distributed cortical signal changes with cavitations (arrows) are evident on a coronal FLAIR (Fluid attenuated inversion recovery) image. These MELAS lesions do not obey the distribution of a major arterial vascular territory. In fact they are not due to a true ischemic infarct of cerebral tissue but to tissue edema and may be transient and partially reversible.

