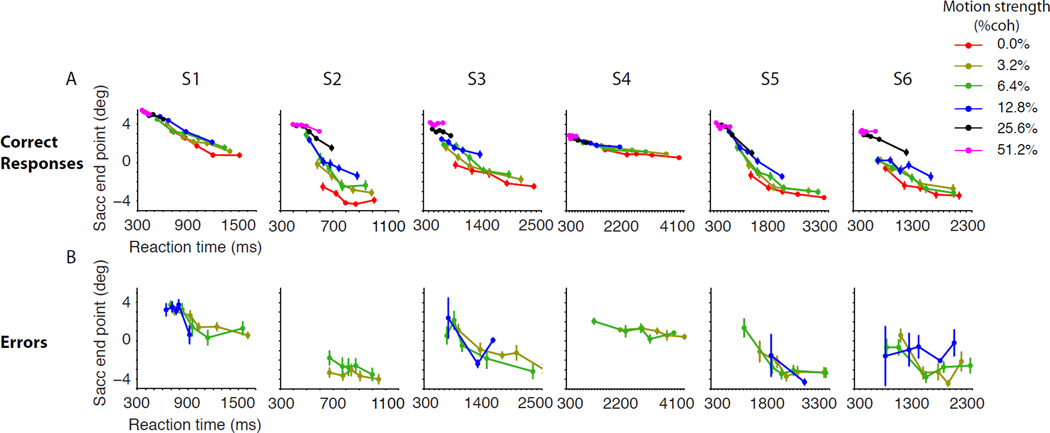
Figure 2. Certainty varies as a function of both RT and motion strength. Each column shows data from one subject (S1–S6).
A. Certainty on correct choices. The horizontal position of the saccade end points are grouped by motion strength and RT. Positive endpoints connote greater certainty. For 0% coherence all trials are included. RTs are grouped in quintiles for each motion strength. B. Certainty on errors. Error bars are s.e.m.

