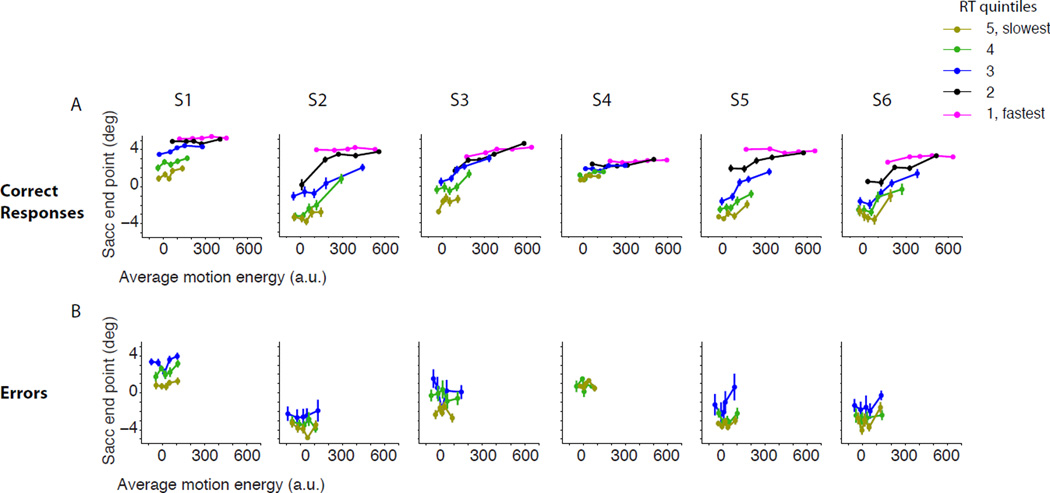
Figure 3. The inverse relationship between RT and certainty is not explained by trial-to-trial fluctuations of the random dot stimulus. Each column represents data from one subject (S1–S6).
For each subject and response condition (correct or error), trials are grouped into quintiles based on RTs (indicated by color). Each RT group is further divided into quintiles based on average motion energy (filled circles). A. Correct trials. Certainty grows with average motion energy but for each average motion energy longer RTs are associated with lower certainty. B. Error trials. For each level of motion energy, certainty is inversely related to RT. Error bars are s.e.m.

