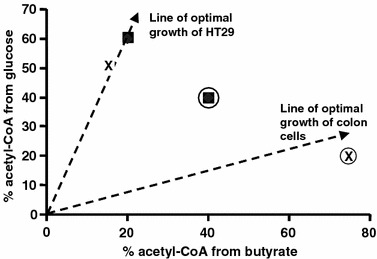
Figure 10.

Glucose and butyrate utilization phase plane (output-output analysis). Utilization of glucose and butyrate under low and high butyrate (circled) conditions by HT29 colonic cancer cells (x) and MIA cells (□) are plotted. Under high butyrate condition, the growth of HT29 cells was reduced and cells expressed alkaline phosphatase as a differentiation marker suggesting different line of optimality for HT29 cells and normal colonic cells.
