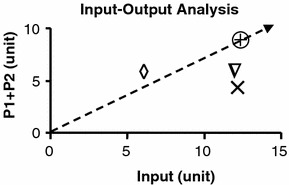
Figure 3.

The plot of output (P1+P2) against input as phenotype in phase plane analysis. The basal phenotype is indicated by
 . The condition v
5=0 is indicated by Δ, v
2=0 indicated by ×, and v
4=0 indicated by
 . The slope of the line indicates the amount of input required for a certain amount of output.
