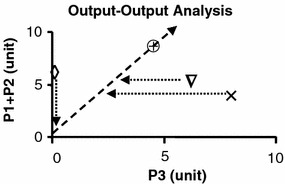
Figure 4.

The plot of output (P1+P2) against P3 as phenotype in phase plane analysis. The basal phenotype is indicated by
 . The condition v
5=0 is indicated by Δ, v
2=0 indicated by × and v
4=0 indicated by
 . The slope of the line indicates the relative proportion of each product under optimal condition. Such a proportion is the result of optimal function of the network. The lines drawn in parallel to each of the axis intersect with the line of optimality reflecting restrictions on optimal phenotype.
