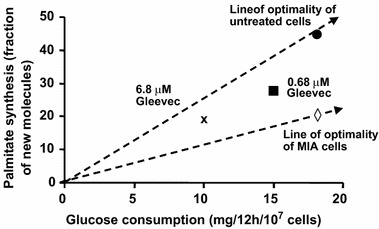
Figure 9.

Glucose consumption (input) and palmitate synthesis (output) phase plane. Phenotype of treated and untreated MIA cells is shown as (
 ). Phenotype of untreated myeloid leukemic cells are shown as •. Phenotype of myeloid leukemic cells treated with low dose and high dose Gleevac are shown as
 and x. MIA cells and myeloid leukemic cells are cancer cells but have different metabolic requirement for their growth as indicated by different lines of optimality. Under Gleevac treatment, the phenotype of leukemics cells deviate from the line of optimality and exhibit reduced growth due to metabolic inefficiency. Data are adapted from article of Boren et al. (2001).
