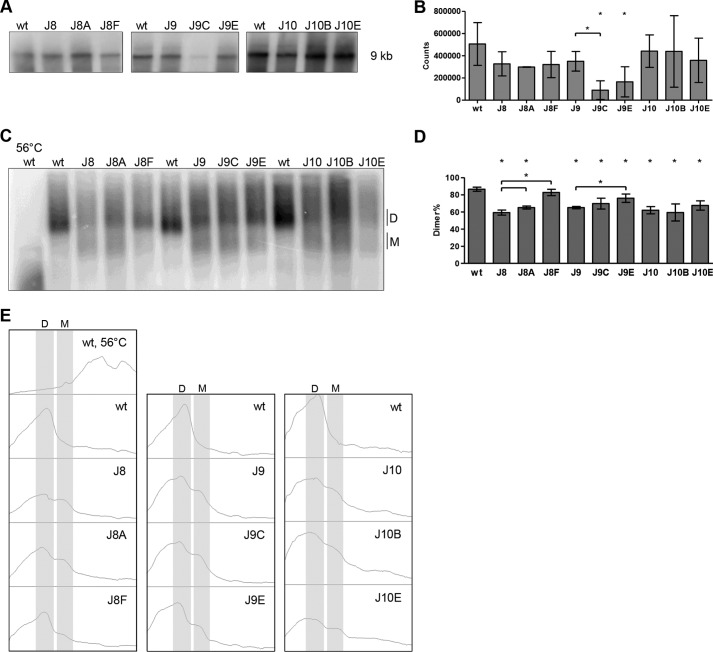
FIGURE 6.
Virion RNA analysis of WT, mutant, and revertant HIV-1 variants. A and C, viral RNA was extracted from virions and analyzed on a denaturing gel (A) or nondenaturing gel (C), followed by Northern blotting. The position of the full-length, 9-kb HIV-1 transcript and monomer (M) and dimer (D) forms are indicated. In the 56 °C lane, the WT RNA sample was heat-denatured prior to gel loading to identify the RNA monomer position. B, quantitation of the 9-kb genomic RNA signals from A. Shown are the means and S.D. (n = 3). Virion RNA content did not vary significantly from the WT level (p > 0.05, Student's t test), except for J9C and J9E. D, quantitation of the RNA dimer and monomer signals from C with the mean and S.D. (n = 3). All RNA signals were quantitated by ImageQuant analysis. Statistical analysis demonstrated that all levels, except for J8F, varied significantly (p < 0.05) from the WT level. J8A and J8F levels varied significantly from the J8 level. The J9E level varied significantly from the J9 level. E, histogram profiles of the lanes in C, monomer (M) and dimer (D) forms are indicated.

