FIGURE 6.
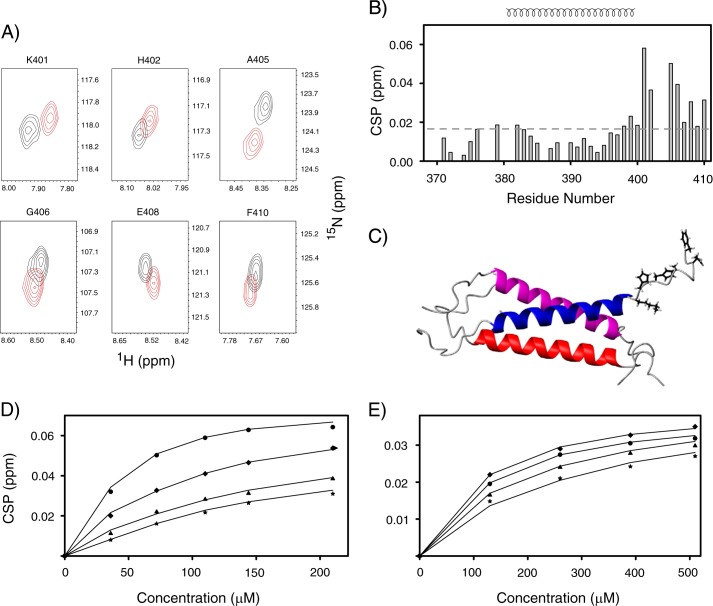
A, overlay of the contour plot of 1H-15N backbone resonances of those residues of TM-LAMP-2A that undergo significant chemical shift changes during chaperone Hsc70 titration (black and red correspond to unbound and bound TM-LAMP-2A, respectively). B, residue-specific CSP of TM domain of LAMP-2A upon addition of the substrate binding domain of Hsc70. The secondary structural elements are shown at the top of B. Residues experiencing significant perturbations are those with CSP values above the standard of deviation (0.016) cutoff shown in a dotted line. These residues belong to the cytosolic tail of LAMP-2A. C, a ribbon representation of TM-LAMP-2A with residues having significant chemical shift perturbation shown as stick models. D and E, fitting of the experimental chemical shift titration data (circle, Lys401; diamond, His402; triangle, Ala405; star, Gly406) to determine Kd for LAMP-2A binding to Hsc70 and RNase A, respectively. The results from the fit are shown as solid lines.

