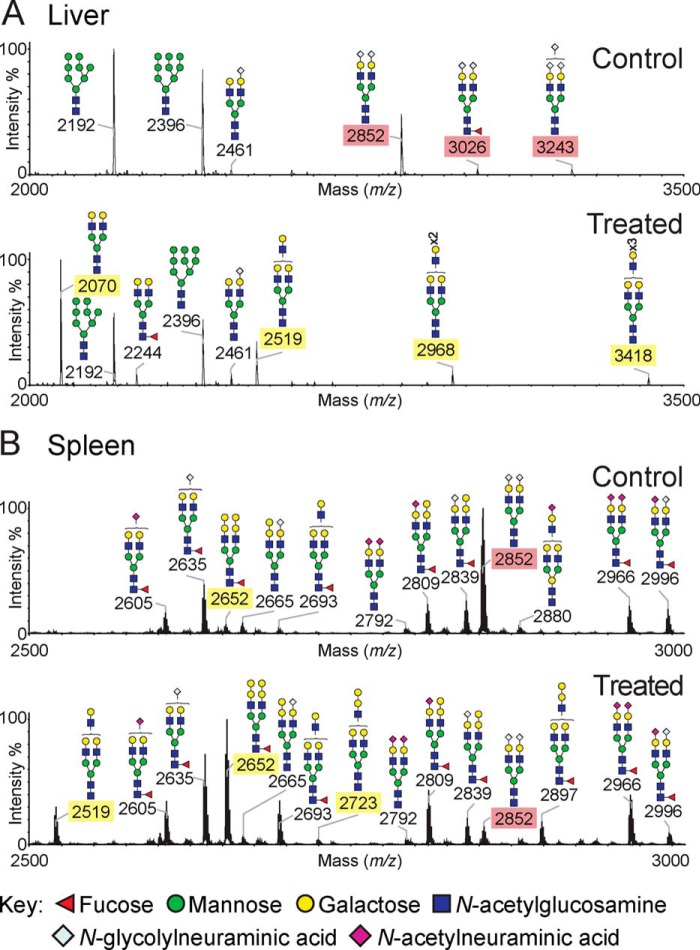
FIGURE 4.
MS glycan profiling of tissues from 3F-NeuAc-treated mice reveals altered sialosides. N-Glycans from liver (A) and spleen (B) were released by peptide N-glycosidase F and permethylated. The data were acquired in the positive ion mode to observe [M + Na]+ molecular ions. Structures shown outside a bracket have not had their antenna location unequivocally defined. For clarity, the sialylated and desialylated glycan species that differ between the control tissues and those taken from mice 11 days after a single injection of 300 mg·kg−1 3F-NeuAc have been highlighted with red and yellow rectangles, respectively. The data are representative of three replicates for each condition.

