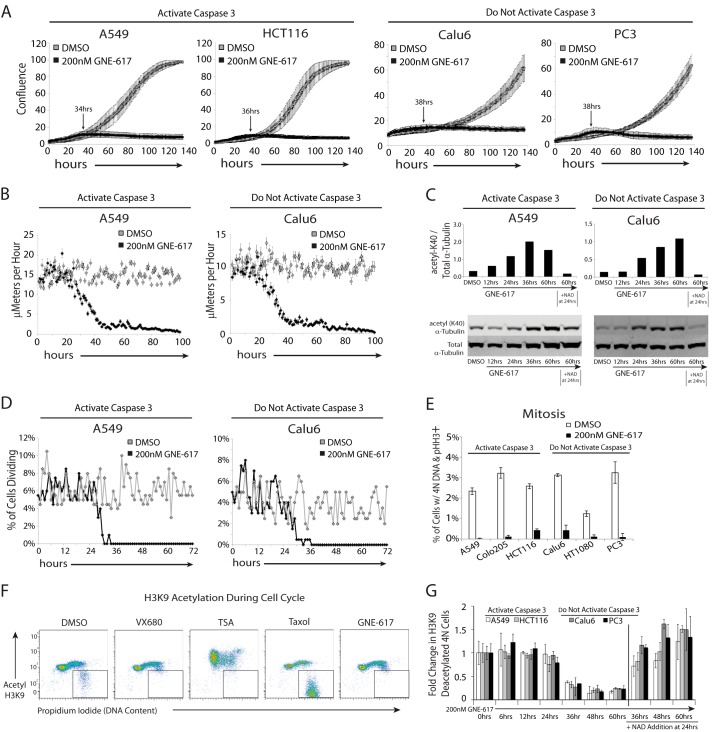
FIGURE 2.
NAD depletion results in broad defects in cell motility and division. A, the indicated cell lines were grown for 138 h ± GNE-617 (200 nm), and cell growth (average confluence) was tracked by live cell imaging (average ± S.D., n = 36 fields of view). The indicated time is the time until maximum confluence for each cell line treated with GNE-617. B, cell motility for A549 and Calu6 cells was measured by tracking the movement of 100 cells over 102 h after treatment with either DMSO or 200 nm GNE-617 using ImageJ/MTrackJ tracking software (average ± S.E., n = 100). C, A549 or Calu6 cells exposed to GNE-617 (200 nm) for various times increased acetylation of α-tubulin-K40 as measured by immunoblot analysis (upper panels show quantification of the bands in the lower immunoblots). The addition of 10 μm NAD at 24 h attenuates this increase in acetylation. D, A549 or Calu6 cells were exposed to DMSO or GNE-617 (200 nm) for 72 h, and in each case 200 cells were tracked over time, and the percentage of cells undergoing cell division is shown. E, each cell line was exposed to DMSO or GNE-617 (200 nm) for 36 h, and the mitotic index was determined by intracellular flow staining to detect phosphorylated histone H3 (Ser10)-positive cells (average ± S.D., n = 3). F, the level of acetyl-histone H3-K9 or DNA (propidium iodide) in HCT116 cells was assessed by intracellular staining after 36 h of exposure to DMSO or 200 nm GNE-617 or after 12 h with either 1 μm VX680, 1 μm trichostatin A (TSA), or 10 μm taxol. G, the level of deacetylated histone H3-K9 and 4 n DNA content (as gated in F) in cells was quantified at various times after the addition of GNE-617 (200 nm) (average ± S.D., n = 3) and after the addition of 10 μm NAD at 24 h.

