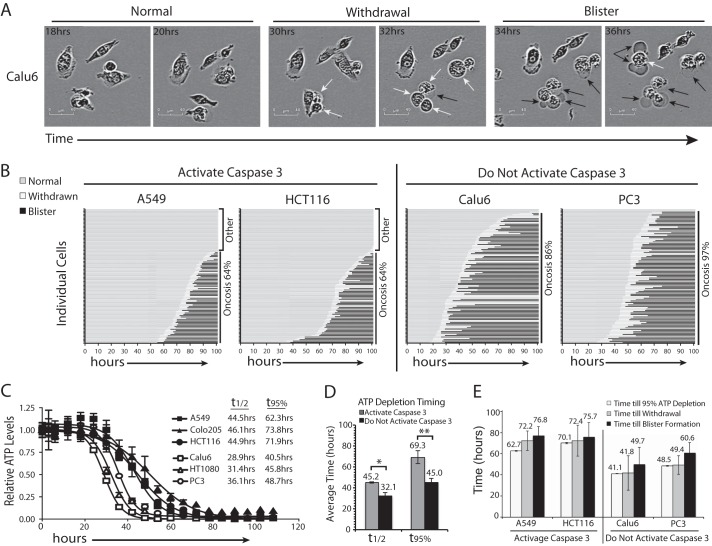
FIGURE 4.
Timing of cell death following NAD depletion. A, representative images of Calu6 cells following treatment with GNE-617 (200 nm) at the indicated times. The withdrawal of membrane extensions (white arrows) is followed by the formation of cell blisters (black arrows). B, for each cell line, 100 individual cells were tracked hourly for 102 h, and the timing of withdrawal of membrane protrusions and formation of blisters are indicated on the graphs. C, cells were exposed to GNE-617 (200 nm) for the indicated times, and ATP levels were determined by CelltiterGlo (average ± S.D., n = 3). D, the average time to depletion of 50% or 95% ATP for cell lines that activate caspase-3 (A549, Colo205, and HCT116) and cell lines that do not activate caspase-3 (Calu6, HT1080 and PC3) was determined. *, p value of <0.025; **, p value of <0.005. E, the average time for cells to display 95% ATP depletion (average ± S.D., n = 3), withdrawal of membrane extensions, and formation of cell blisters are indicated (average ± S.D., n = 100).

