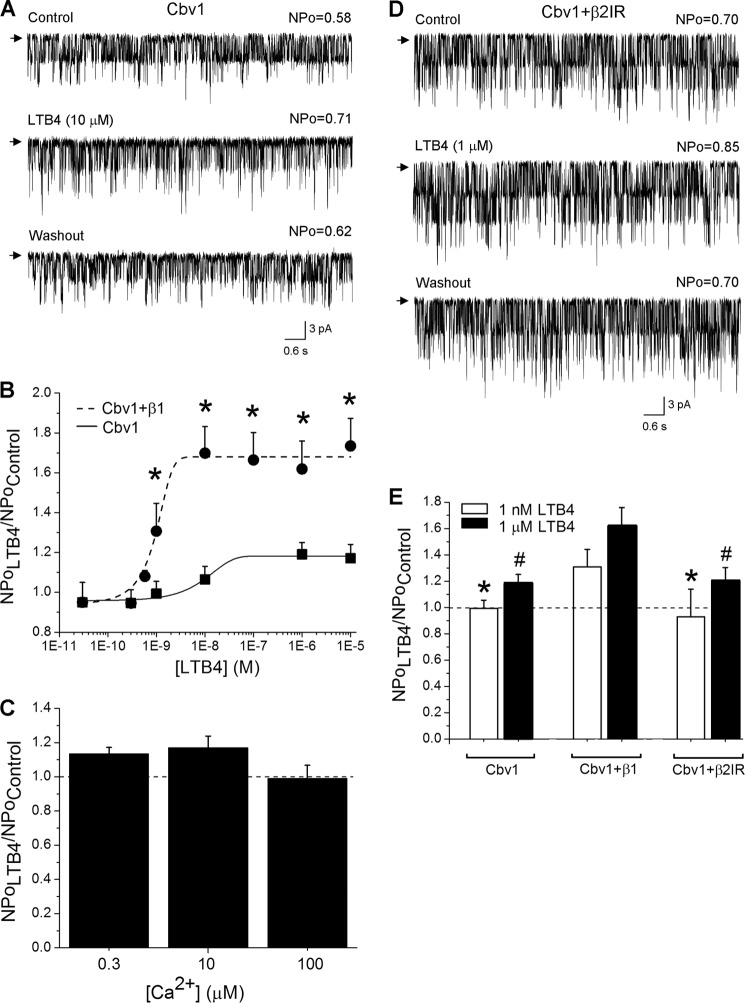
FIGURE 4.
LTB4-induced BK channel activation requires the presence of BK β1 subunits. A, single-channel recordings from I/O patches excised from X. laevis oocytes expressing the cbv1 channel. Current records depict cbv1 channel activity before, during, and after 10 μm LTB4 application. Vm = −20 mV; [Ca2+]i = 10 μm. B, concentration-response curve for LTB4 in the absence of BK β1 subunit (EC50 = 80 nm). A concentration-response curve obtained from β1-containing BK channels is presented as a positive control (EC50 = 1 nm). Each point represents the average of no fewer than three patches, each patch obtained from a different oocyte. *, different from cbv1-β1 (p < 0.05). C, lack of LTB4-induced cbv1 channel activation is observed across different [Ca2+]i levels. Each bar is obtained from no fewer than three membrane patches, each excised from a different oocyte. D, single-channel recordings from I/O patches excised from X. laevis oocytes expressing the cbv1-β2IR channel. Current records depict cbv1-β2IR channel activity before, during, and after 1 μm LTB4 application. Vm = −40 mV; [Ca2+]i = 10 μm. E, averaged data showing differential effect of LTB4 on cbv1, cbv1-β1, and cbv1-β2IR channels. A horizontal dashed line highlights the level at which NPo remains unchanged. Each bar is obtained from no fewer than three membrane patches, each excised from a different oocyte. *, different from 1 nm LTB4 on cbv1-β1 (p < 0.05). #, different from 1 μm LTB4 on cbv1-β1 (p < 0.05). Error bars, S.E.

