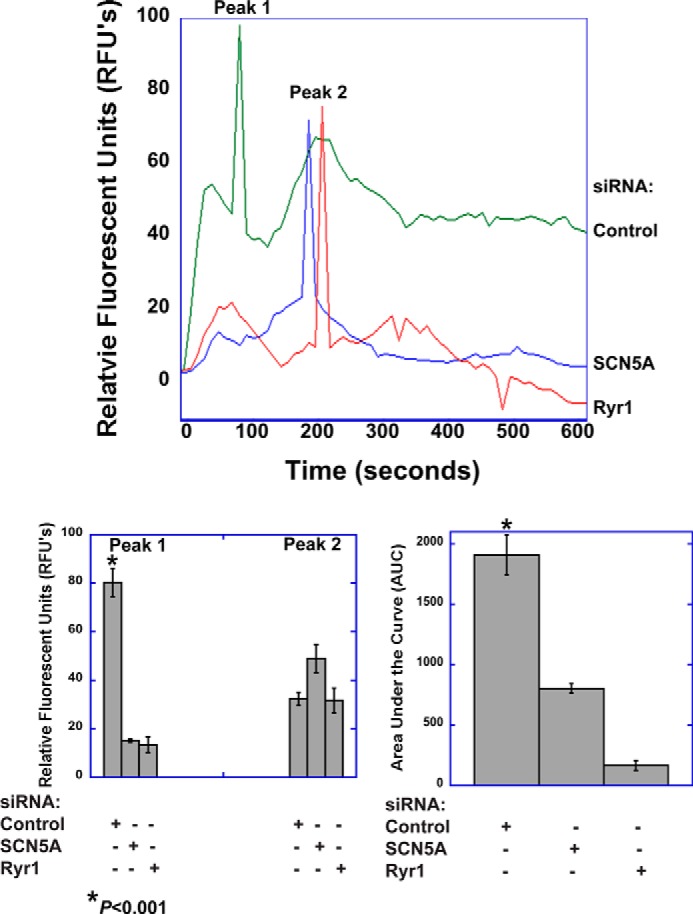
FIGURE 5.

SCN5A mediates a veratridine-induced calcium response in human monocyte-derived macrophages. Human MDM were labeled with the calcium indicator Fluo4 and imaged by time-lapse live cell microscopy. Stimulation of human MDM with veratridine (100 μm) elicited a biphasic peak response and a more prolonged elevation in cytosolic calcium. The initial peak response (Peak 1) and the sustained response, but not Peak 2, were dependent on expression of SCN5A and RYR1. Images were acquired at 10-s intervals for 10 min and subsequently analyzed in ImageJ and MATLAB. The top graph shows representative tracings for each condition. The bar graphs show quantitative analysis of peak responses and the cumulative response (AUC, area under the curve). For peak 1, the mean responses were as follows: 80.2 ± 5.8 RFUs for control siRNA, 15.1 ± 4.9 for SCN5A knockdown, and 13.4 ±3.2 for RYR1 knockdown (p < 0.001 for control condition, ANOVA, n = 10 regions of interest, error bars, ±S.E.). For peak 2, 32.3 ± 2.7 for control siRNA, 48.9 ±5.8 for SCN5A knockdown, and 31.7 ± 5.1 for RYR1 knockdown (not significant, ANOVA, n = 10). The AUC was 1909.0 ± 163.1 for the siRNA control condition, 803.3 ± 192.5 for SCN5A knockdown, and 164.6 ± 40.3 for RYR1 knockdown (p < 0.001 for control condition, ANOVA, n = 10).
