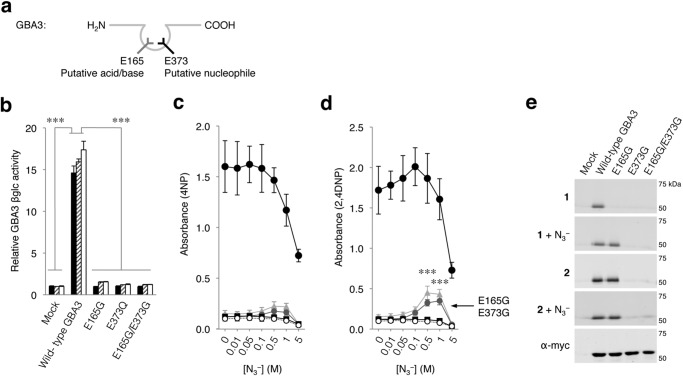
FIGURE 4.
Cytosolic β-glucosidase GBA3. a, schematic depicting GBA3 with predicted acid/base (left, gray) and nucleophile (right, black). b, catalytic activity of GBA3 variants toward 4MU-, 4NP-, and 2,4DNP-β-d-Glc relative to mock (black, hatched, white columns, respectively). Sodium azide-mediated rescue of 4NP (c)- and 2,4DNP-β-d-Glc (d) hydrolysis by mock (empty plasmid, open circles), wild-type GBA3 (filled circles), E165G (gray triangles), E373Q (gray circles), and E165G/E373G (black squares). e, overexpressed myc/His-tagged GBA3 variants in total COS-7 cells with excess ABP 1 or ABP 2 and subsequently purified via His-tag pulldown. Labeling with ABP 1 in the absence/presence of sodium azide (first and second gels), idem with ABP 2 (third and fourth gel), and GBA3 detected with α-myc (fifth gel). Data are the average of triplicates ± S.D., with one-way analysis of variance significance; ***, p < 0.001.

