
FIGURE 5.
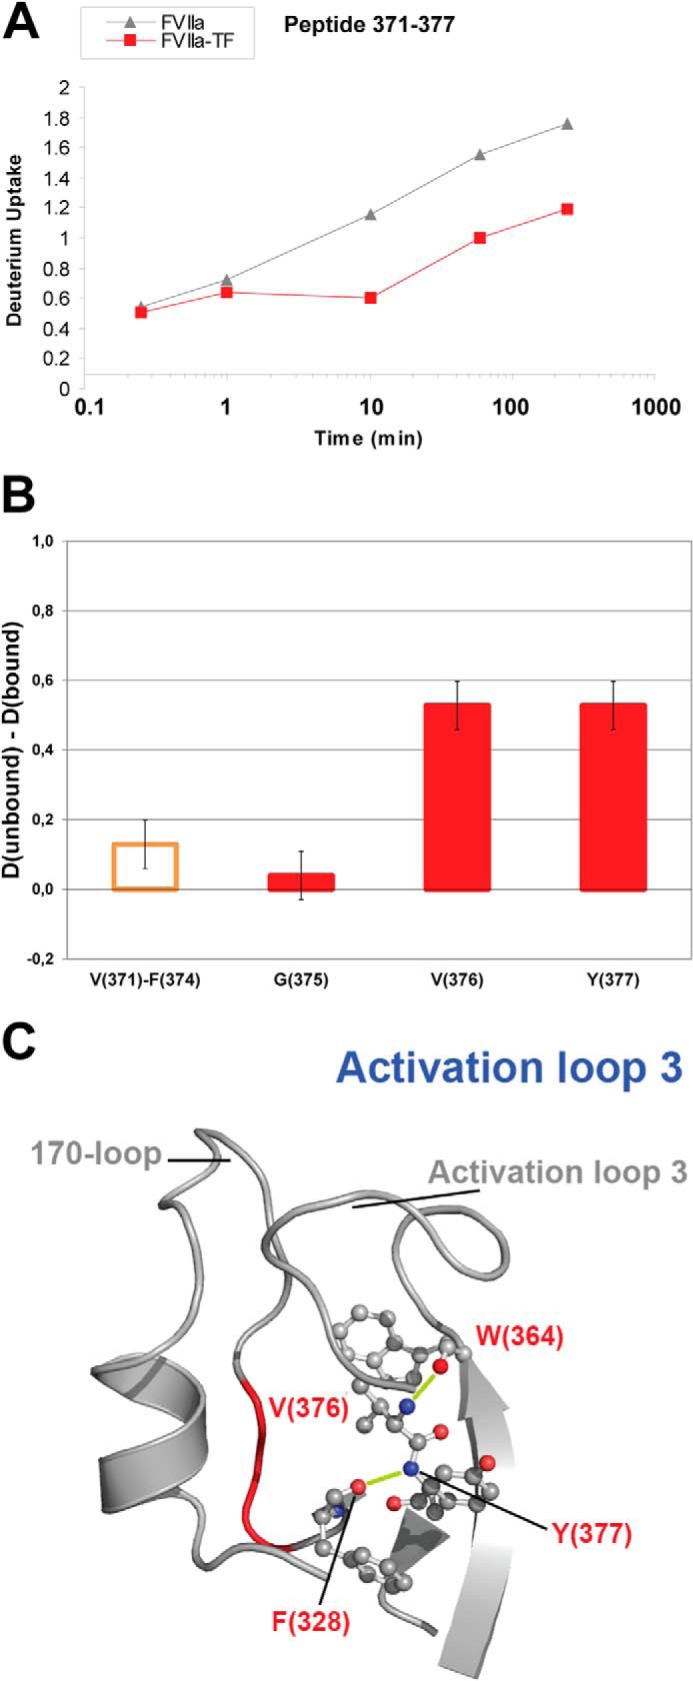
HDX of activation loop 3. A, HDX plot of peptide 371–377 from activation loop 3. B, localized difference in deuterium uptake for individual residues (red bars) or segments (orange bar) of peptide 371–377 from unbound versus TF-bound FVIIa after 4 h exchange time. C, structural representation of activation loop 3 with individual sites shown by ETD to undergo reduced HDX upon TF binding highlighted (PDB ID: 1DAN). Based on HDX-ETD data in B, H-bonds involving amide hydrogens from residues Val-376 and Tyr-377 that are destabilized or absent in unbound FVIIa are shown in lime.