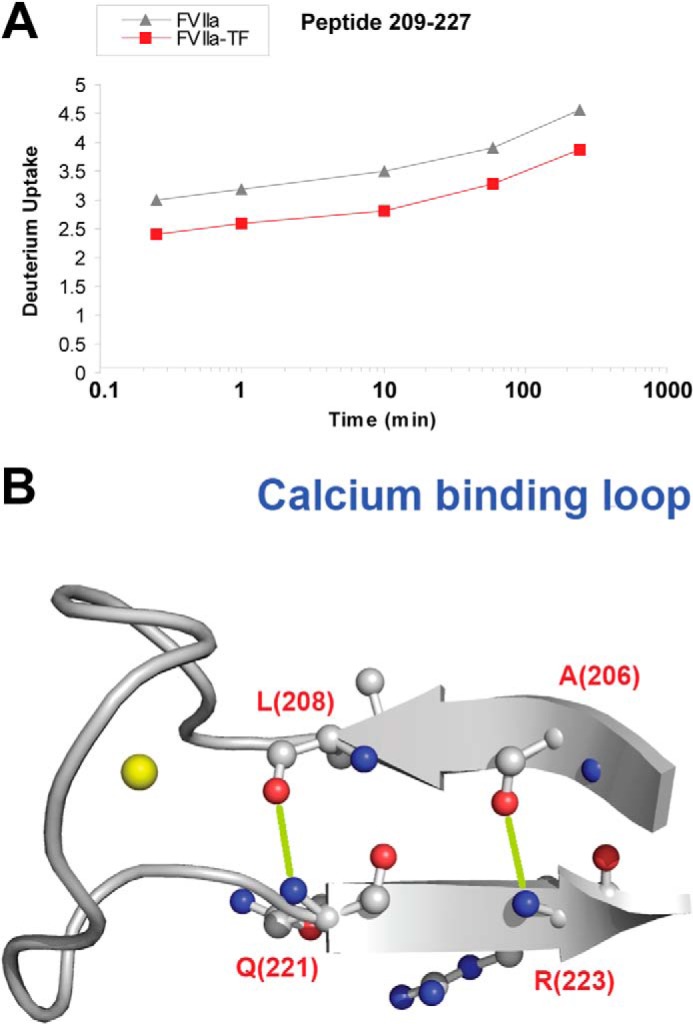
FIGURE 6.

HDX of the Ca2+-binding loop. A, HDX plot of peptide 209–227 from the Ca2+-binding loop. B, structural representation of the Ca2+-binding loop. The calcium ion is depicted as a yellow sphere. Sites that undergo reduced HDX upon TF binding based on ETD measurements on peptide 209–227 are localized to residues Gln-221-Arg-224 (PDB ID: 1DAN). H-bonds involving amide hydrogens from residues Gln-221 and Arg-223 that are likely to be destabilized or absent in unbound FVIIa are shown in lime.
