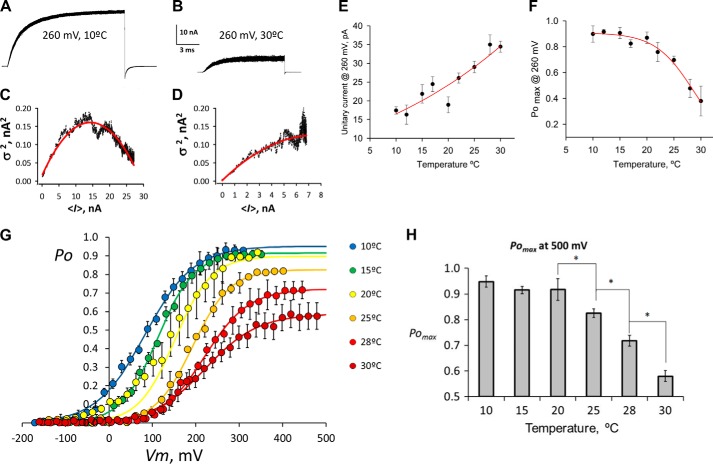
FIGURE 3.
Voltage is a partial activator of TRPM8. A, 200 superimposed current traces in response to 260-mV pulses from a holding potential of −60 mV, recorded at 10 °C. B, same patch heated up to 30 °C and a slightly shorter 260-mV voltage pulse was repeated 200 times. C and D, variance versus mean current plot from isochronal sampling of the current traces shown in A and B, respectively. Red solid lines correspond to the best fit to each plot using Equation 2. Results from fit were as follows: i = 20 pA, n = 1431, Po, max = 0.91 in C, and i = 30 pA, n = 1452, Po, max = 0.41 in D. E, estimation of unitary current at 260 mV from variance analysis over a wide range of temperatures. Values are average ± S.E. for a set of 3–12 different patches. The red line corresponds to the expected current calculated from the Arrhenius plot with activation energy of 6.3 kcal mol−1. F, Po, max at 260 mV versus temperature. Po, max was obtained from the noise analysis data fitted by using Equation 2. Values are average ± S.E. for a set of 3–12 different patches. G, absolute probability of opening (Po) versus voltage curve. Each curve corresponds to a Itail(V)/Imax(T) versus voltage of A scaled by using the Po, max measured at 260 mV. Error bars are S.E. (3 < n < 12). Lines drawn over the points are Boltzmann functions scaled according to the open channel probability at 260 mV for each temperature displayed on F. H, column graph shows Po, max for 500 mV at different temperatures predicted by the Boltzmann fits of G. Error bars are the 95% confidence limits as reported by the nonlinear curve fitting procedure of SigmaPlot 10. Asterisks indicate nonoverlapping 95% confidence limits of Po, max.

