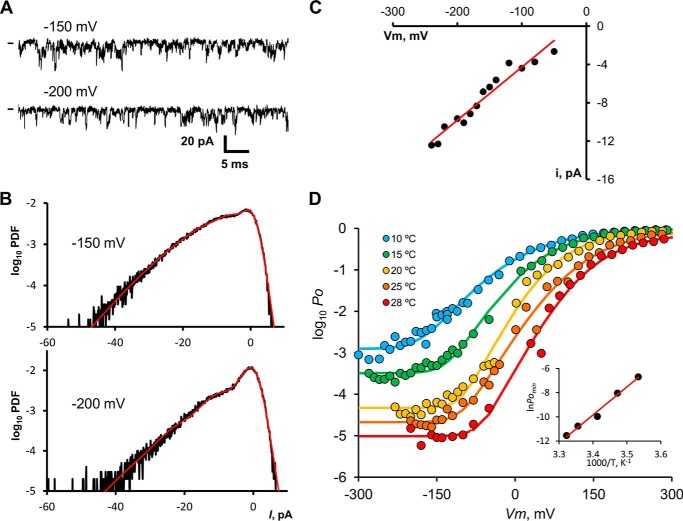
FIGURE 4.
Limiting slope of logPo − V curve. A, samples of current recorded from a patch containing ∼500 TRPM8 channels at −150 and −200 mV at 15 °C. Channel openings are seen as brief downward deflections. Current data stream analogically filtered with a 8-pole Bessel filter tuned for a −3 db attenuation at 10 kHz, and it was digitized at a rate of 5 μs per point. B, normalized all-point histograms of current records taken at −150 and −200 mV lasting 2 s are shown in semi-log plots. Red lines drawn over the histograms are fits to the Poisson convolved with a Gaussian distribution (see “Experimental Procedures”), which allows us to retrieve the NPo value for each holding voltage. C, unitary current obtained from the Gaussian-convolved Poisson fit to the all-point histograms shown in B. Unitary conductance for this particular experiment (15 °C) was equal to 55 ± 3.9 pS from linear regression (solid line). D, absolute Po versus voltage curves for five temperatures, compiled for a set of 3–5 patches at each temperature. For log10Po < −2, Po was calculated from NPo determined using stationary current noise analysis, and N was calculated from nonstationary noise analysis. Data for log10Po > −2 were obtained from instantaneous tail currents and corrected for the maximum Po measured at 260 mV through nonstationary noise analysis. Solid lines are fits to a modified Boltzmann function: Po = Pmin + (Pmax − Pmin)/(1 +exp(−zF(V − V0)/RT)4. Pmin values are 1.1 × 10⁻³ at 10 °C, 3.1 × 10⁻⁴ at 15 °C, 4.3 × 10⁻⁵ at 20 °C, 2.6 × 10⁻⁵ at 25 °C, and 9.3 × 10⁻⁶ at 28 °C. Inset, ln(Po, min) versus 1/T. Because Po, min ≪1, we can approximate Keq ≈ Po, min. Red straight line corresponds to ΔH = −45.9 kcal mol−1 for the opening reaction only through temperature sensor activation.

