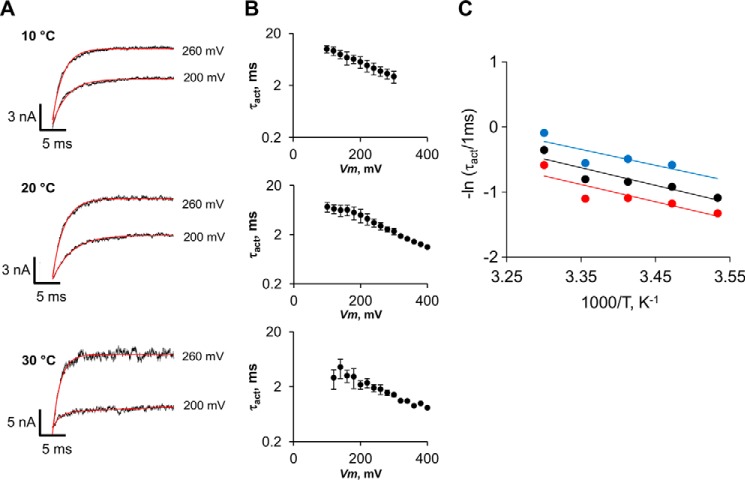
FIGURE 6.
Voltage and temperature dependence of activation time constants. A, TRPM8 current traces in response to 200- and 260-mV pulses from a holding potential of −60 mV, acquired at 10, 20, and 30 °C. Activation time constants (τact) were determined by a mono-exponential fit (solid red line). B, corresponding τact versus voltage relationships for each temperature are shown in A. Vertical error bars are S.E. (n = 7). C, Arrhenius plot of activation time constants measured at 260 mV (red), 300 mV (black), and 340 mV (blue). Activation energies of 5.3, 5.4, and 4.8 kcal mol−1 for 260, 300, and 340 mV, respectively, were calculated from the slopes of the linear regressions (straight lines).

