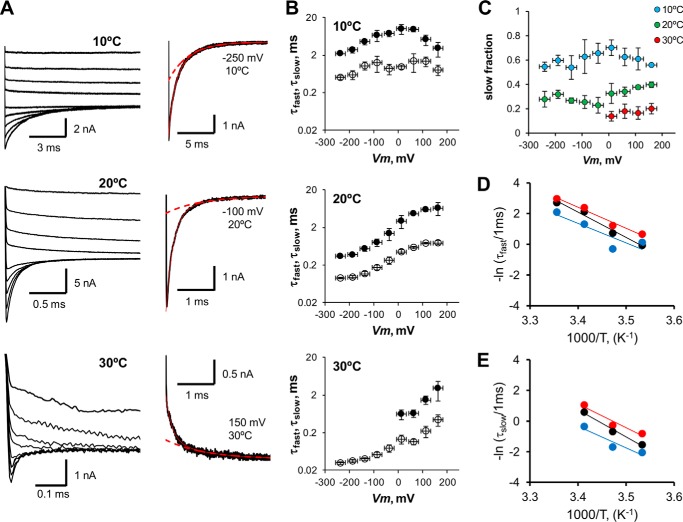
FIGURE 7.
Voltage and temperature dependence of TRPM8 deactivation. A, TRPM8 current traces in response to different voltage pulses (from −250 to 200 mV in 50-mV increments), after a prepulse of 260 mV acquired at 10, 20, and 30 °C. A bi-exponential decay (solid red line) is needed to properly fit the deactivation time course for the majority of voltages tested. Dashed red line corresponds to the slow component of the relaxation. B, fast (τfast, open circles) and slow (τslow, filled circles) time constant versus voltage at 10, 20, and 30 °C. The slow component is absent for negative voltages at 30 °C. Data were averaged in 50-mV bins for clarity. Error bars are S.E. (n = 5). C, plot of relative slow component amplitude as a function of voltage, calculated for 10, 20, and 30 °C. D, Arrhenius plot of fast deactivation time constant. Red, black, and blue circles correspond to deactivation rates at −240, −140, and −40 mV. From the slope of linear regression, the activation energies are 27.2, 32.6, and 25.0 kcal mol−1, respectively. E, Arrhenius plot of slow time constant. Red, black, and blue circles correspond to the same voltages as in D. Activation energies from the slope of linear regressions are 30.8, 35.2, and 27.8 kcal mol−1, respectively.

