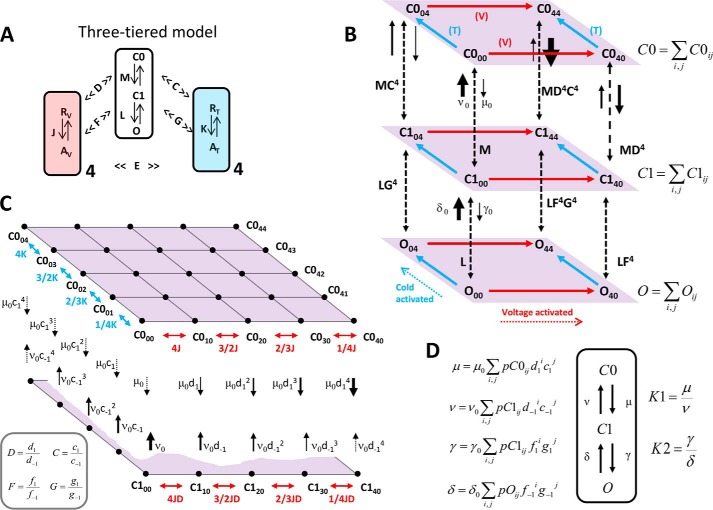
FIGURE 9.
Three-tiered allosteric model. A, simplified scheme shows the central opening reaction proceeding in two steps as follows: a transition between two closed states C0-C1, and a transition representing channel opening C1-O. In the absence of voltage and cold stimuli, these transitions are governed by the equilibrium constant M = C1/C0 and L = O/C1, respectively. Four voltage sensors (light red) and four temperature sensors (light blue) are governed by the voltage-dependent and temperature-sensitive equilibrium constants J = exp(zJ(Vm − V0)F/RT) and K = exp(−(ΔH − TΔS)/RT), respectively. Activation of these sensors by their respective stimuli, multiplies the M and L equilibrium constants to different extents due to allosteric interactions. Each voltage sensor activation shifts M and L equilibria toward the open state by allosteric factors D and F, respectively. Each temperature sensor activation shifts M and L equilibria toward the open state by allosteric factors C and G, respectively. E is an allosteric factor describing the interaction factor between the voltage sensor and temperature sensor. B, pore conformations C1, C2, and O consist of a set of sub-states grouped in three levels (tiers). Sub-states of each level are labeled with two indexes i and j (for example C0ij), which represent the possible combination of activated sensors, being i and j the number (0, 1, 2, 3, 4) of active voltage and temperature sensors, respectively. For clarity, only extreme sub-states are shown. Red and cyan arrows parallel to each level represent the direction of voltage- and cold-driven activation, respectively. Vertical dashed arrows represent the different transition pathways between corresponding sub-states of each tier. For instance, in the absence of active sensors, the opposing rate constants μ0 and ν0 determine the equilibrium constant M, whereas γ0 and δ0 are the corresponding rate constants for L. Active voltage and temperature sensors shift the C0-C1 and C1-O equilibria by increasing the forward reaction and by decreasing the backward reaction. This is depicted with solid arrows of different widths representing the magnitude of each rate constant for the C0-C1 transitions. The same principle applies to the C1-O transitions (not shown for clarity). C, detailed view of the C0 level emphasizing all the combinations of active voltage and temperature sensors (black dots). Double pointing red arrows are voltage-dependent equilibrium constants between states with no active temperature sensors. Conversely, double-pointing cyan arrows are temperature-dependent equilibrium constants between states with no active voltage sensors. Assuming that voltage sensors move independently, the equilibrium constants for the successive steps are 4J, 3/2J, 2/3J, and 1/4J. The same progression applies for the four temperature sensors. Each sub-state of the C0 level has an associated rate for transit to the corresponding sub-state in the C1 level, and vice versa, which are represented by downward and upward black arrows. The magnitude of each rate depends on the number of active voltage and temperature sensors. Allosteric factors applied to the equilibrium constants have to be split into two allosteric factors to be applied to the corresponding rate constants (e.g. D is split into d1 and d−1). The four relations enclosed within the gray box (bottom left) are required to enforce the principle of detailed balance. In particular, for any ij combination of voltage and temperature sensors, the downward rate constant is μ0 multiplied by d1ic1j. The equilibrium and rate constants for the remaining sub-states are omitted for clarity. D, assuming equilibrium within each level (C0, C1, O), one can condense the whole tier in one state giving rise to a simple C0-C1-O three-state model. Four voltage- and temperature-dependent rate constants μ, ν, γ, and δ can be calculated as the weighted contribution of every sub-state in each tier, according to their corresponding probability, pC0ij, pC1ij, and pOij (see “Appendix A”). The corresponding voltage- and temperature-dependent equilibrium constants K1 and K2 derived from the condensed scheme C0-C1-O are determined by the rate constants as noted in the figure.

