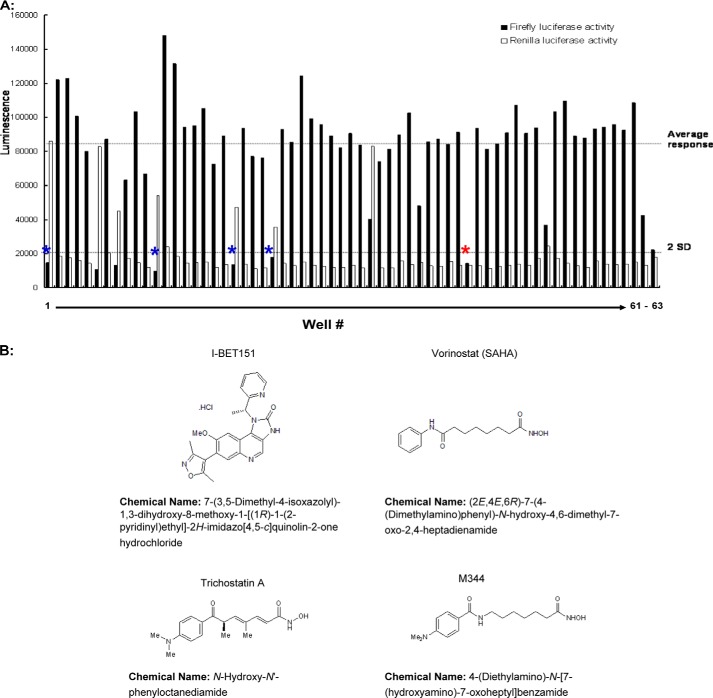
FIGURE 1.
A screen for epigenetic inhibitors of HH signaling. A Light2 reporter cell line, engineered to express a Gli site-driven luciferase reporter gene and TK-driven control luciferase gene, was treated with the Smo activator SAG (100 nm). These cells were subsequently utilized to screen a panel of 60 small-molecule inhibitors targeting various epigenetic regulators. A, four different concentrations of inhibitors were used: 0.5, 1, 2, and 10 μm, and results for 2 μm are shown. The mean responses to these various inhibitors (top dashed line) and two standard deviations of this mean (bottom dashed line) are shown. Columns 1–60 represent individual epigenetic enzyme inhibitors, whereas columns 61–63 represent DMSO, vismodegib (100 nm), and unstimulated activity, respectively. The positive hits from this screen are highlighted by blue asterisks or a red asterisk (I-BET151). B, chemical structures of small-molecule HH inhibitors.

