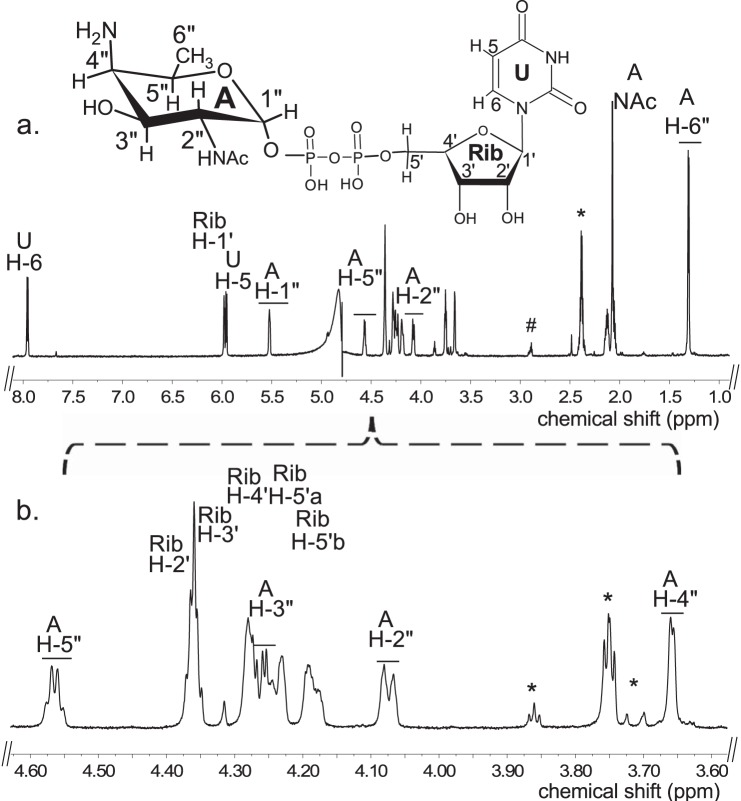
FIGURE 4.
Analysis of Pat C4″-aminotransferase reaction products by 1H NMR indicates formation of UDP-4-amino-d-FucNAc. The product of the Pat reaction (peak A, marked by an arrow in Fig. 3a, panel 2) was collected and analyzed at 800 MHz NMR. a, full proton spectrum of the Pat enzyme product UDP-4-amino-d-FucNAc, A. b, expanded proton spectra between 3.6 and 4.6 ppm that shows the FucNAc-4N sugar ring. The short line above NMR “peaks” denotes specific chemical shifts belonging to a UDP-4-amino-FucNAc. * denotes column contamination, and # denotes DSS.

