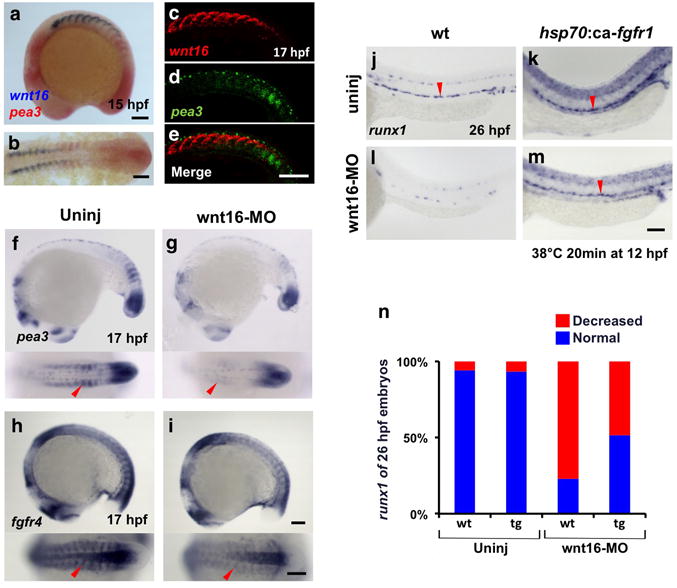
Figure 4. Wnt16 controls FGF signaling activity.

(a, b) Expression of wnt16 (blue) and pea3 (red) at 15 hpf by two-color enzymatic whole-mount and flat-mount in situ hybridization. (c–e) Confocal images of FISH for wnt16 (red in c), pea3 (green in d), or merge (e) at 17 hpf. (f–i) Lateral and dorsal views of expression of pea3 (f, g) and fgfr4 (h, i) in wnt16 morphants at 17 hpf compared to uninjected controls as indicated at top. (j–m) WISH for runx1 expression (black arrowheads) at 26 hpf following ectopic activation of FGF signaling using hsp70:ca-fgfr1 induced at 12 hpf (38°C 20 min) in wnt16 morphants. (n) runx1 phenotype percentages in wnt16-MO injected hsp70:ca-fgfr1 transgenic embryos (tg) heat-shocked at 12 hpf, compared to wnt16-MO injected wt embryos (uninjected wt, n=34; uninjected tg, n=44; wnt16-MO injected wt, n=48; wnt16-MO injected tg, n=37). Red arrowheads indicate WISH signals of pea3 and fgfr4 in the somites (f–i) and runx1 in the DA (j–m). Scale bars=100μm.
